
Your delivery fleet runs on 99.5% uptime promises. That number sits in contracts, gets quoted to customers, drives penalty clauses. But walk into most fleet shops and ask how their preventive maintenance schedule connects to that SLA target—you'll get blank stares or vague hand-waving about "following manufacturer guidelines."
The disconnect kills operations. A regional food distributor learned this the hard way when their generic 5,000-mile PM intervals left them with a 94% actual uptime while promising clients 98%. The gap cost them $180,000 in penalties over six months, plus two major accounts who jumped ship.
SLA driven preventive maintenance for fleet operations isn't about creating perfect schedules. It's about building PM cadences that directly support your uptime commitments while accounting for real-world chaos—parts delays, technician shortages, seasonal surges. The math gets tricky but the payoff is massive: fleets that align PM to SLA targets typically see 15-20% fewer breakdowns and cut penalty payments by 70% or more.
The backwards math that connects uptime to wrench time
Most fleet managers build PM schedules forward: manufacturer says service every X miles, so we service every X miles. But uptime-driven scheduling works backwards. You start with your promised availability percentage and work back to required PM frequency.
Take a standard box truck doing last-mile delivery. Your SLA promises 98% uptime. That means maximum 7.3 days of downtime per year per vehicle. Now factor reality: each PM service takes 6 hours minimum, unexpected repairs average 14 hours annually based on historical data, and parts availability adds another 8 hours of waiting time yearly.
That leaves you roughly 4.5 days for planned maintenance. At 6 hours per PM, you can afford 9 services annually. For a truck running 60,000 miles per year, that's every 6,600 miles—not the 7,500 miles the manual suggests.
Annual available downtime hours = (1 - SLA%) × 365 × 24
PM service slots = (Available hours - Unplanned repair hours - Parts wait hours) ÷ PM duration
PM interval = Annual mileage ÷ PM service slots
A concrete hauler running similar calculations discovered their 99% uptime commitment meant servicing mixers every 180 operating hours instead of the recommended 250. The tighter schedule cost an extra $42,000 in maintenance annually but eliminated $200,000+ in contract penalties.
Visual workflow for converting SLA to PM frequency:
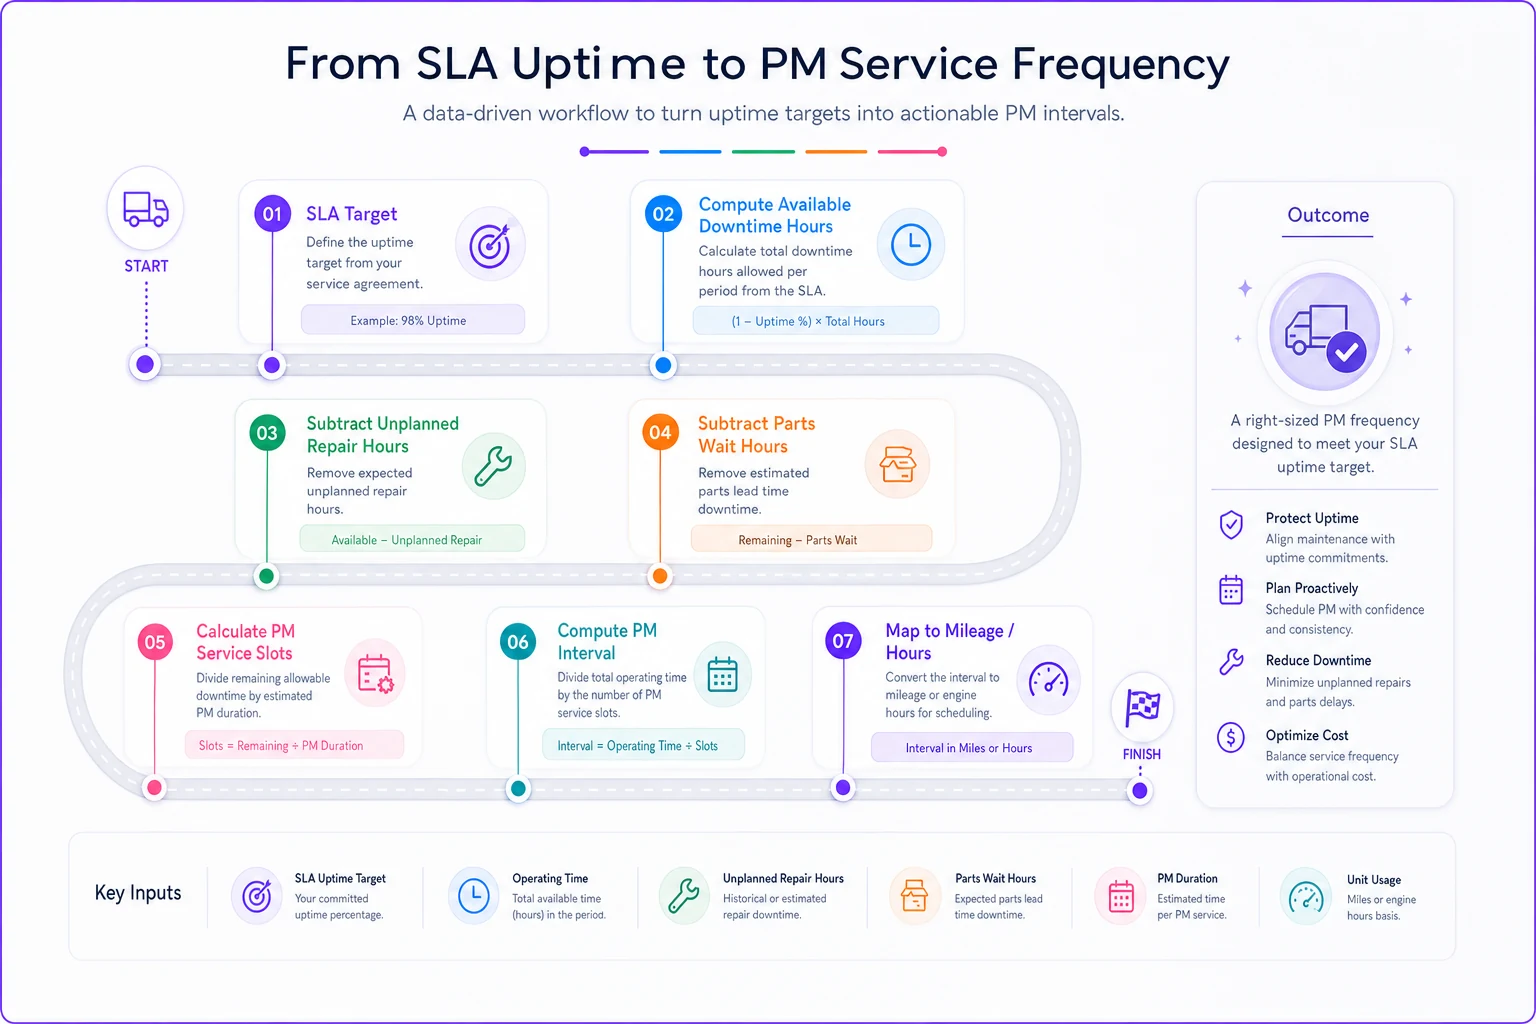
This diagram shows the step-by-step backward calculation.
Sample SLA to PM conversions across different fleet types
The conversion changes dramatically based on vehicle type and usage pattern. A refrigerated truck hauling pharmaceuticals needs different math than a utility bucket truck or a school bus.
Prevent costly breakdowns with proactive maintenance.
Fleetelyly helps you schedule, track, and manage every vehicle service efficiently.
- Automated maintenance reminders
- Real-time service tracking
- Parts inventory integration
No credit card required
| Vehicle Type | SLA Target | Annual Miles/Hours | Downtime Budget | PM Frequency | Interval |
|---|---|---|---|---|---|
| Delivery Van | 98% | 45,000 miles | 175 hours | 14 services | 3,200 miles |
| Semi Truck | 97.5% | 120,000 miles | 219 hours | 18 services | 6,600 miles |
| Utility Truck | 99% | 250 engine hours | 87 hours | 8 services | 31 hours |
| School Bus | 99.5% | 18,000 miles | 44 hours | 6 services | 3,000 miles |
| Refrigerated Box | 98.5% | 55,000 miles | 131 hours | 12 services | 4,580 miles |
These aren't universal truths—they're starting points. A plumbing company's service vans might hit the same 98% target with looser intervals if they build in vehicle redundancy. A medical transport company can't play those games.
The critical factor most shops miss: usage intensity matters more than raw mileage. A delivery van doing 200 stops daily wears differently than one doing 40 highway miles. We track "severity factors" that adjust intervals.
-
Stop-and-go multiplier
1.3x for urban delivery
-
Idle time factor
1.2x for vehicles idling >30% of runtime
-
Load factor
1.15x for consistently maxed GVWR
-
Environmental factor
1.25x for dusty/corrosive conditions
Stack these multipliers and your 5,000-mile interval becomes 3,200 miles fast.
Building resource plans that support the cadence
Converting SLA targets to PM schedules means nothing if you lack the resources to execute. Most shops discover they need 30-40% more technician hours than originally budgeted once they implement proper SLA-driven scheduling.
Start with technician capacity. If your SLA-driven schedule requires 14 PMs per vehicle annually at 6 hours each, that's 84 tech hours per vehicle just for preventive work. Add 20% for findings during PM (belts, filters, minor repairs) and another 15% for unscheduled repairs. Now you're at 115 hours per vehicle per year.
A 50-vehicle fleet needs 5,750 annual tech hours. At 1,800 productive hours per technician per year (accounting for training, meetings, vacation), you need 3.2 technicians dedicated to this fleet. Round up to 4 for coverage.
But resource planning gets interesting when you realize not all vehicles need service simultaneously. Plot your PM schedule across a calendar and you'll see demand spikes. A waste management company discovered their SLA-driven schedule created a 40% demand spike every third Thursday when multiple routes aligned. They solved it by staggering vehicle start dates in the PM cycle—simple but nobody thinks about it until they're scrambling for technicians.
Stagger vehicle service start dates to smooth technician demand and reduce peak-week overtime.
Bay capacity follows similar logic. Each PM ties up a bay for 8 hours (including vehicle movement, parts staging, paperwork). Your peak PM week might have 12 services scheduled. That's 96 bay-hours. With 50 working hours per bay per week, you need minimum 2 bays just for PM work. Add another for repairs and findings.
Parts inventory explodes under SLA-driven schedules. Tighter PM intervals mean burning through filters, fluids, and wear items 20-30% faster. A transportation company operating on standard intervals kept $45,000 in rotating PM parts inventory. Moving to SLA-driven scheduling pushed that to $58,000—but eliminated $15,000 monthly in expedited shipping when parts ran out unexpectedly.
Exception handling without breaking promises
Real operations don't follow spreadsheets. Trucks break between PMs, parts go backorder, technicians call in sick. Your SLA-driven schedule needs built-in exception protocols that maintain uptime even when everything goes sideways.
The hierarchy of exceptions determines what can slide and what can't.
-
Never skip, never delay
Safety-critical inspections (brakes, steering), regulatory requirements (DOT inspections), warranty-preservation services
-
Delay up to 10% of interval
Standard oil changes, filter replacements, tire rotations
-
Combine with next service if within 20% of interval
Fluid top-offs, belt adjustments, battery checks
A regional courier built these exceptions into their scheduling software. When a vehicle missed its PM window due to route demands, the system automatically checked which category the overdue items fell into. Category 1 triggered immediate scheduling regardless of impact. Category 2 items got flagged yellow with a countdown timer. Category 3 merged into the next PM.
The real test came during peak season. While running 15% over normal capacity, they maintained 97.8% uptime against a 97.5% SLA by following exception protocols. Vehicles ran slightly past some PM intervals but never hit critical failure points.
Exception handling also needs override triggers. When a vehicle shows specific symptoms, the normal PM schedule gets tossed.
-
Oil analysis showing metal particles → Immediate PM regardless of schedule
-
Coolant in oil → Stop operation, full inspection
-
Brake wear at 4mm → Schedule within 48 hours
-
Check engine light with drivability issues → Same-day diagnosis
These overrides pulled from historical failure data. A fleet running produce to grocery stores analyzed 18 months of breakdowns and found 73% showed warning signs 5-7 days before failure. They built those warning signs into override triggers, catching problems before they killed uptime.
The compounding effect of interval adjustments
Small PM interval changes create massive downstream impacts. Tightening your service schedule by 20% doesn't just mean 20% more services—it reshapes your entire operation.
A concrete company moved from 300-hour to 240-hour PM intervals on their mixer trucks to support 99% uptime. The 20% tighter schedule triggered:
-
25% increase in oil consumption (more changes)
-
18% rise in filter costs
-
22% more technician overtime
-
15% increase in parts storage needs
-
12% jump in warranty claim rejections (over-servicing)
But also:
-
67% drop in roadside breakdowns
-
82% reduction in SLA penalties
-
45% decrease in emergency repair costs
-
30% improvement in fuel economy (better-maintained engines)
Net result: $127,000 additional PM costs, $340,000 savings in repairs and penalties.
The compounding happens because tighter PM intervals catch problems earlier. A municipal fleet tracked component failure rates before and after moving to SLA-driven scheduling. Alternator failures dropped 60%, starter failures fell 45%, and transmission issues decreased 70%. Each prevented failure saved not just repair costs but 8-12 hours of emergency downtime that would've broken SLA commitments.
Watch for interval sweet spots. Tightening too much wastes money without improving reliability. A logistics company experimented with PM intervals from 4,000 to 7,000 miles on identical delivery trucks. The data showed diminishing returns below 5,000 miles—reliability stayed flat while costs climbed. Their sweet spot landed at 5,200 miles for their 98.5% SLA target.
Early warning systems that protect uptime
SLA-driven PM schedules handle planned maintenance, but unplanned failures still happen. Building early warning systems into your operation catches problems before they violate uptime commitments.
Driver reporting makes or breaks early detection. But "tell us if something sounds funny" doesn't work. You need specific, measurable triggers drivers actually follow. A beverage distributor created a simple three-point morning check:
-
Cold start
Engine cranks more than 3 seconds? Flag it.
-
First mile
Any vibration through steering wheel? Flag it.
-
First stop
Brake pedal travel more than halfway? Flag it.
Drivers marked a simple Yes/No on their phones. Takes 30 seconds. Caught 85% of developing issues before breakdown.
Fluid analysis provides another warning layer. But instead of analyzing everything constantly (expensive and overwhelming), use targeted sampling triggered by:
-
Vehicles approaching 80% of component life expectancy
-
Any vehicle with two driver flags in one week
-
Random 10% monthly sample for baseline
-
Any vehicle returning from major repair
A regional carrier using this approach caught early transmission wear on 12 vehicles through fluid analysis. Preventive rebuilds cost $2,800 each. Roadside transmission failures would've cost $7,500 plus 3-4 days downtime—instant SLA violation.
Your scheduling software can build in progressive warnings as PM intervals approach. Instead of binary "due" or "overdue," use escalating alerts:
-
75% of interval
Schedule next PM
-
90% of interval
Daily reminders to dispatcher
-
95% of interval
Alert to operations manager
-
100% of interval
Vehicle hold until serviced
-
105% of interval
Automatic SLA risk report
These graduated warnings prevent the common scenario where vehicles suddenly hit overdue status with no advance planning.
Balancing uptime math with business reality
Perfect SLA-driven PM schedules collide with business constraints. You can't always pull revenue-generating vehicles for service exactly when the formula says. The balance requires structured flexibility.
Build maintenance windows into your SLA agreements from the start. A medical supply company negotiated 4-hour monthly maintenance windows into their 99.5% uptime contracts. Sounds minor but it provided crucial flexibility—they could schedule PMs during predictable low-demand periods without violating agreements.
Consider vehicle redundancy as part of your SLA equation. Instead of pushing every vehicle to maximum uptime, maintain 10-15% spare capacity. A wheelchair transport service runs 22 vehicles for 20 daily routes. The two extras cost $40,000 annually but allow aggressive PM scheduling on the primary fleet without service disruption.
Factor seasonal variations into your PM planning. If December brings 40% more deliveries, you can't maintain normal PM schedules. A furniture delivery fleet pre-loads maintenance in October and November, running 15% tighter intervals before peak season. They accept slightly higher maintenance costs for two months to avoid any December downtime.
Some fleets create "PM debt" tracking—when business needs force delayed maintenance, they track accumulated risk:
-
500 miles overdue = 1 risk point
-
1,000 miles overdue = 3 risk points
-
1,500 miles overdue = 6 risk points
-
Over 2,000 miles = 10 risk points + mandatory scheduling
When total fleet risk exceeds 25 points, operations triggers mandatory catch-up weekend with overtime technicians. Prevents gradual slide into breakdown territory.
Technology integration without drowning in data
Modern fleet management platforms promise AI-powered PM optimization, but most shops get buried in alerts and reports nobody reads. Effective SLA-driven maintenance needs focused technology use, not dashboard overload.
Start with simple PM tracking that connects to your SLA metrics. Track three numbers religiously:
-
PM schedule adherence (% completed on time)
-
Unplanned downtime hours per vehicle
-
Cost per mile/hour for maintenance
That's it. Everything else is commentary.
A distribution company replaced their 47-metric dashboard with these three numbers displayed on a shop floor monitor. Technicians finally understood how their work connected to company goals. PM adherence jumped from 72% to 91% in three months just from visible accountability.
Automation should handle scheduling complexity, not decision-making. Let software track intervals, send alerts, and calculate resource needs. But humans decide exception handling and priority calls. A utility company learned this after their "smart" scheduling system consistently prioritized wrong vehicles during emergencies, causing cascade failures across their SLA commitments.
When selecting fleet management software, focus on platforms that understand the relationship between maintenance operations and business commitments. The system should track both mechanical health and contractual obligations, automatically flagging when PM delays might trigger SLA violations. Good platforms let you model different PM scenarios against your uptime targets before committing resources.
Integration with parts inventory prevents the common failure point where perfect PM schedules collapse due to parts unavailability. The software should trigger reorders based on upcoming PM schedules, not just minimum quantity levels. A landscaping company cut parts-related delays 78% by switching to schedule-based ordering that looked 30 days ahead.
Converting theory to Monday morning reality
All this math and planning means nothing if it doesn't survive contact with Monday morning chaos. Regional food distributor transformed their operation from theory to practice with methodical implementation.
They started with 47 refrigerated trucks running 97.3% uptime against 98.5% SLA requirements. Penalties averaged $32,000 monthly. Their existing PM schedule followed manufacturer recommendations: every 7,500 miles or 6 months.
First step: They calculated their true allowable downtime. At 98.5% SLA, each truck could be down 131 hours annually. Historical data showed 42 hours of unplanned repairs per truck. That left 89 hours for PM—enough for 11 services at 8 hours each.
Their trucks averaged 67,000 miles annually, meaning PM every 6,090 miles to hit 11 services. But they added severity factors: stop-and-go delivery routes (1.3x) and extended idling for refrigeration (1.2x). Final interval: 3,900 miles.
Resource planning revealed they needed 5 technicians, not their current 3.5. They hired two more but staggered start dates to spread training impact. Bay capacity was tight—they converted a storage area to a third PM bay for $18,000.
Implementation happened gradually. They moved 10 trucks to the new schedule monthly, learning and adjusting. Issues emerged immediately: parts inventory ran out week two, technicians felt rushed, drivers complained about frequent service interruptions.
The adjustments came fast. They created parts buffer stock worth $12,000, introduced a "PM prep" role where one person stages parts and vehicles, negotiated 6-hour monthly maintenance windows with major customers, and built exception protocols for peak delivery periods.
Results after 6 months: uptime improved to 98.7% (exceeding SLA), penalties dropped to $3,000 monthly average, unexpected breakdowns fell 64%, maintenance costs rose $67,000 annually. Net savings: $317,000 annually.
The transformation wasn't smooth. Month two saw their worst uptime ever (96.1%) as technicians learned new rhythms. Three drivers quit, citing "constant shop time." But by month four, the system clicked. Drivers appreciated reliable vehicles, technicians liked predictable workflow, and operations hit their numbers.
The compound benefit of uptime discipline
Fleets that successfully implement SLA-driven PM scheduling discover benefits that extend far beyond maintenance costs. The discipline required to align maintenance with uptime commitments transforms operational culture in unexpected ways.
Accountability
Fleets that successfully implement SLA-driven PM scheduling discover benefits that extend far beyond maintenance costs. The discipline required to align maintenance with uptime commitments transforms operational culture in unexpected ways.
Ready to maximize fleet uptime and reduce maintenance costs?
Join 2,000+ fleet managers using Fleetelyly to streamline maintenance workflows and improve vehicle reliability.