
Most fleet operations hit the same wall around 40-50 vehicles. The maintenance manager tracks repairs in one spreadsheet, finance has budget projections in another system, and department heads argue about who pays for what. By the time you need your first real audit, you're scrambling to connect dots between work orders from eight months ago and budget variances nobody can explain.
The breakdown starts innocently enough. You've got decent preventive maintenance, your mechanics know their stuff, and accounting has their quarterly reports. But fleet maintenance budgeting chargeback systems? That's where everything falls apart. Nobody connects actual repair decisions to financial forecasting, and certainly nobody creates audit trails that make sense six months later.
When maintenance meets finance: the coordination nightmare
Fleet maintenance budgeting sits at this awkward intersection where operational decisions meet financial reality. Your mechanic sees a transmission starting to slip on truck #47. Should they rebuild it for $3,800 or recommend replacement at $42,000? Meanwhile, finance needs to know if this hits the repair budget, capital expenditure, or gets charged back to the department using that vehicle.
The real mess happens because these decisions compound. That transmission decision affects next quarter's maintenance reserves. It changes the vehicle replacement timeline. It impacts the chargeback rate for the department using that truck. And if you're running multiple cost centers or departments with their own P&Ls, suddenly everyone's arguing about fairness while you're just trying to keep vehicles on the road.
What makes this particularly brutal is that fleet managers are making 15-20 of these decisions weekly. Each one needs documentation, financial coding, departmental approval sometimes, and somehow needs to feed into both current budgets and future forecasts. Most operations handle this with email chains, verbal approvals, and that one Excel file that only Mike from accounting really understands.
Rolling forecasts that actually roll (instead of breaking)
Traditional annual budgets for fleet maintenance are basically fiction by month three. You set aside $180,000 for repairs based on last year, then three engines blow in February and suddenly your whole year is shot. Smart operations have moved to rolling forecasts, but even those break down without the right structure.
Prevent costly breakdowns with proactive maintenance.
Fleetelyly helps you schedule, track, and manage every vehicle service efficiently.
- Automated maintenance reminders
- Real-time service tracking
- Parts inventory integration
No credit card required
A working rolling forecast for fleet maintenance needs three data streams that most operations never connect. First, you need actual repair history tied to specific vehicles and components. Not just "spent $4,200 on truck repairs in March" but "truck #31 needed alternator replacement at 127,000 miles, cost $820, performed by Tech B, took 3.2 hours." This granular data feeds your prediction models.
Second stream is your preventive maintenance schedule projected forward. If truck #31 needs transmission service at 150,000 miles and it's currently at 142,000 averaging 2,000 miles monthly, that's a $450 expense hitting in four months. Multiply that by your entire fleet and you've got your baseline forecast.
Third stream is your vehicle lifecycle positioning. Every vehicle in your fleet sits somewhere on the repair-versus-replace curve. A 2019 delivery van with 95,000 miles has different forecast implications than a 2021 van with 45,000 miles. Your rolling forecast needs to account for where each vehicle is in its lifecycle and what that means for both repair probability and replacement timing.
Making these three streams talk to each other in real-time is the challenge. When a major repair happens, it should automatically adjust the vehicle's position on the replacement timeline. When you accelerate a replacement, the forecast should immediately reduce projected repair costs for that unit. Most operations try to manage this manually and it becomes a full-time job just keeping the forecast updated.
Reserve triggers nobody actually triggers
Every fleet operation has some version of maintenance reserves. Usually it's a percentage of revenue or a fixed monthly allocation. The problem isn't setting aside the money - it's knowing when to release it versus when to build it higher.
Reserve triggers should work like this: when repair frequency for vehicles over 100,000 miles increases 20% above baseline, you automatically boost reserves by $2,000 per vehicle per month. When you're running 30% under baseline for two consecutive months, you can release funds back to operations. Except nobody actually tracks these metrics in a way that triggers anything.
The breakdown happens because the triggers aren't connected to actual operational data. Finance sets a reserve policy based on some consultant's recommendation or industry benchmark. Meanwhile, the maintenance team sees real patterns - older vehicles breaking down more frequently, certain models having premature transmission issues, seasonal spikes in battery failures. But these observations never make it into the reserve calculations.
Tie your reserve triggers directly to vehicle age brackets and repair frequency:
| Vehicle Age | Miles | Target Reserve | Trigger Up (+25%) | Trigger Down (-25%) |
|---|---|---|---|---|
| 0-2 years | <50k | $200/month | $250/month | $150/month |
| 2-4 years | 50-100k | $400/month | $500/month | $300/month |
| 4-6 years | 100-150k | $750/month | $940/month | $560/month |
| 6+ years | 150k+ | $1,200/month | $1,500/month | $900/month |
These triggers need to automatically adjust based on actual repair data, not calendar reviews. When three vehicles in the 4-6 year bracket need major repairs in the same month, that should immediately flag a reserve adjustment, not wait for next quarter's finance meeting.
The chargeback maze that makes everyone angry
Internal chargebacks for fleet usage might be the single most contentious part of fleet operations. Every department thinks they're overpaying, maintenance feels underfunded, and finance is stuck in the middle trying to referee arguments about "fairness."
The typical chargeback system is a disaster of averaged costs and arbitrary allocations. Sales gets charged $800 per vehicle per month whether they drive 500 miles or 5,000. Operations runs their trucks into the ground but pays the same rate as admin whose vehicles sit in the parking lot. Then when a $6,000 transmission repair hits, everyone argues about whose budget it comes from.
A functional chargeback system needs to reflect actual usage and risk. Start with base allocation for fixed costs - insurance, registration, depreciation. Then add variable charges for actual mileage, with rates that increase based on vehicle age. A 2023 sedan driven 1,000 miles monthly might cost $450 base plus $0.12 per mile. That same sedan in 2027 with 80,000 miles costs $450 base plus $0.22 per mile because maintenance risk is higher.
The real key is handling major repairs. Instead of surprising departments with huge bills, build a repair risk pool into the monthly chargebacks. Departments using older vehicles pay higher monthly rates that fund the pool. When major repairs hit, they come from the pool, not departmental budgets. This smooths out the cost spikes and stops the finger-pointing when something breaks.
The math might look like this for a mid-size operation:
-
Department A
5 vehicles, average age 2 years, 3,000 miles/month = $3,200 monthly chargeback
-
Department B
8 vehicles, average age 5 years, 6,000 miles/month = $7,400 monthly chargeback
-
Department C
3 vehicles, average age 4 years, 1,500 miles/month = $2,100 monthly chargeback
Those rates fund both routine maintenance and the major repair pool. When Department B's transmission fails, it doesn't blow up their quarterly budget - it's already covered by the pool they've been funding based on their higher-risk fleet profile.
Repair versus replace: the decision matrix everyone ignores
Every fleet has some version of a repair/replace policy. Usually it's something like "replace at 150,000 miles or 7 years" or "don't spend more than 50% of value on repairs." These rules sound logical until you're staring at a $5,000 repair estimate on a vehicle worth $8,000 that's critical for tomorrow's deliveries.
The real decision matrix needs multiple factors weighted against each other:
Current vehicle metrics:
-
Age and mileage
-
Repair history (frequency and cost)
-
Current market value
-
Reliability score (breakdowns per 10,000 miles)
Operational factors:
-
Vehicle criticality (can operations continue without it?)
-
Replacement lead time
-
Specialized equipment or modifications
-
Driver training requirements
Financial considerations:
-
Repair cost versus 12-month TCO
-
Capital budget availability
-
Financing rates and terms
-
Tax implications of replacement timing
Most operations try to juggle these factors in their head during a crisis. The transmission just died, the vendor needs an answer by noon, and you're making a $40,000 decision based on gut feel and whatever numbers you can pull together in an hour.
A working decision matrix pre-calculates thresholds based on your specific operation. For instance, vehicles under 3 years never get replaced unless totaled. Vehicles 3-5 years get repaired if cost is under 40% of replacement value. Vehicles 5-7 years need the full matrix evaluation. Vehicles over 7 years or 150,000 miles only get safety-critical repairs.
The matrix needs to be dynamic. When used vehicle prices spike 30% (like they did 2021-2022), your replacement thresholds should automatically adjust. When interest rates jump from 4% to 8%, the financing cost changes your calculations. Static policies lead to consistently bad decisions.
Building audit trails while you work (not six months later)
Come audit time, you need to explain why you spent $73,000 replacing transmissions last year when the budget was $45,000. The auditor wants to see the decision process, approvals, and how it ties to your reserve policies. Most fleet managers start frantically digging through emails and old spreadsheets, trying to reconstruct decisions made eight months ago.
The audit trail should build itself as you operate. Every repair authorization should automatically capture:
-
Vehicle condition at time of decision
-
Repair versus replace analysis
-
Department chargeback allocation
-
Impact on rolling forecast
-
Reserve fund utilization
-
Approval chain with timestamps
This isn't about bureaucracy - it's about operational memory. Six months from now when someone questions why you rebuilt the engine on truck #52 instead of replacing the vehicle, you need the complete picture from that moment, not a vague recollection that "it made sense at the time."
The documentation should live where the work happens. When your technician diagnoses a problem, that triggers the repair/replace analysis. When you authorize the repair, it automatically updates the forecast and triggers the chargeback. When the work completes, it feeds back into your vehicle history and adjusts future reserve calculations. One workflow, multiple systems updated, complete audit trail.
A simple workflow diagram helps visualize the audit trail process.
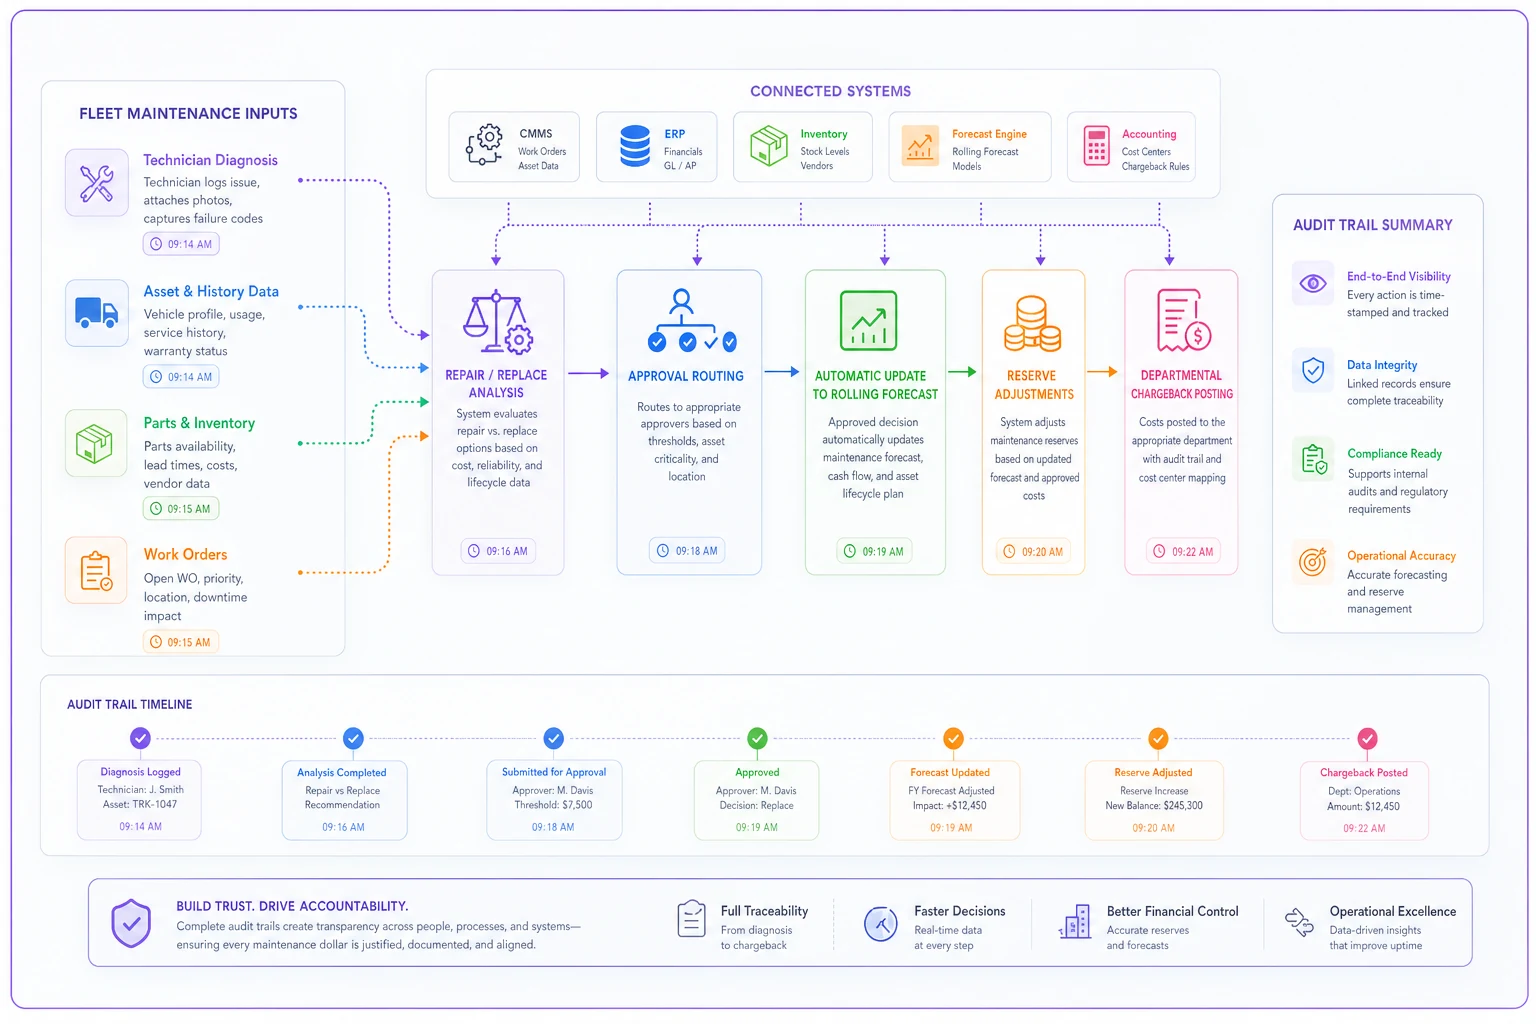
This diagram shows how a single action updates multiple systems and creates an auditable record.
Where automation actually helps (and where it doesn't)
The promise of fleet management software is always the same - everything in one place, real-time dashboards, automated everything. The reality is you've got maintenance tracking in one system, financial reporting in another, and a bunch of Excel sheets trying to bridge the gap.
Where AI-powered operational software actually helps is in connecting these separate streams. When a repair order closes in your maintenance system, AI automation can automatically code it for accounting, update the vehicle's lifecycle status, adjust the rolling forecast, and calculate the departmental chargeback. No manual data entry, no lag time, no forgotten updates.
The pattern recognition is particularly useful for reserve adjustments. Instead of manually reviewing repair trends quarterly, AI agents can continuously monitor repair frequency across your fleet and flag when specific vehicle models or age brackets are trending outside normal ranges. That 20% spike in transmission repairs for your 2018 vehicles? The system catches it immediately, not three months later during a budget review.
But automation can't replace judgment calls. When that transmission estimate comes in at $5,200 for a vehicle worth $7,000, you still need human evaluation. What automation does is gather all the relevant data - repair history, replacement options, budget impact, operational needs - and present it in a format that enables quick, informed decisions. Then it documents that decision and updates all connected systems.
The real value is in the coordination. Most fleet operations have decent individual processes. The maintenance team knows how to diagnose and repair. Finance knows how to budget and forecast. What breaks is the connection between these processes. AI automation serves as the operational nervous system, ensuring that a decision in maintenance immediately reflects in finance, and a budget adjustment immediately informs repair authorizations.
Making it actually stick
The gap between having these systems and actually using them consistently is where most operations fail. You spend weeks setting up the perfect chargeback formula, build out your repair/replace matrix, design beautiful dashboards... then three months later everyone's back to email approvals and Excel sheets.
The system has to be easier than the workaround. If updating the rolling forecast requires six steps across three systems, people will just update it quarterly (maybe). If getting repair authorization means filling out four forms, your technicians will just text the fleet manager for verbal approval.
Design the repair authorization screen so one click captures the issue, runs the matrix, shows budget impact and routes approval.
Start with the daily workflow and build out from there. Your technician identifies a needed repair. One entry captures the issue, triggers the repair/replace analysis based on your matrix, shows the budget impact, and routes for approval. The approver sees everything they need in one view - vehicle history, financial impact, operational priority. One click approves, updates all systems, and documents the decision.
The rolling forecast updates automatically as repairs are completed. Reserve triggers monitor themselves and alert when adjustments are needed. Departmental chargebacks calculate and post monthly without manual intervention. The audit trail builds itself as natural output of operations.
Build the system right and it becomes easier to follow the process than to work around it.
The compound effect of connected operations
When these pieces actually work together, the compound effect is dramatic. Your rolling forecast becomes genuinely predictive because it's fed by real operational data, not estimates. Your reserve funds match actual risk because they adjust based on real repair patterns. Departments stop fighting about chargebacks because the allocation clearly ties to usage and risk.
But the biggest change is in decision speed. That transmission repair decision that used to eat up half a day? Now it takes 30 minutes because all the data is there. Budget variances that used to surprise you quarterly? Now you see them developing weeks in advance. Audit requests that used to trigger panic? Now it's just running a report.
The difference between operations that scale successfully and those that hit a ceiling around 50-60 vehicles usually comes down to this operational infrastructure. It's not about having more people or better mechanics or bigger budgets. It's about having systems that connect your operational reality to your financial planning in real-time, with decision frameworks that work consistently whether you're managing 30 vehicles or 300.
Fleet maintenance budgeting and chargeback systems aren't exciting. They're not what you think about when you're growing your fleet operation. But they're the invisible infrastructure that determines whether growth makes you stronger or just makes everything harder. Build them right, and they fade into the background while your operation runs smoothly. Ignore them, and you'll spend every quarter explaining budget variances while departments argue about repair bills and auditors question your decisions from six months ago.
The path forward isn't complicated, but it requires thinking about these systems as connected parts of one operation, not separate administrative tasks. Your repair decisions affect your financial forecasts. Your chargebacks influence department behavior. Your reserve policies impact your ability to handle surprises. Connect these pieces with the right operational structure - whether through AI-powered platforms or just better processes - and the whole system starts working for you instead of against you.
Ready to maximize fleet uptime and reduce maintenance costs?
Join 2,000+ fleet managers using Fleetelyly to streamline maintenance workflows and improve vehicle reliability.