
Your fleet's running fine. Maintenance costs stay predictable. Then you notice something in the repair logs—that transmission issue on truck #47 looks familiar. You dig deeper. Same problem three months ago. Different mechanic, different shop, same expensive fix that didn't fix anything.
This isn't about bad mechanics or faulty parts. It's about missing the patterns hiding in your repair data.
Most fleet operations treat each breakdown as an isolated incident. Vehicle comes in, gets fixed, goes back out. When you start tracking root causes properly, the numbers get uncomfortable. A medium-sized delivery fleet with 85 vehicles typically has 12-15% of their annual maintenance spend going to repeat failures. Not planned maintenance or expected wear—the exact same problems coming back month after month.
Why repeat repairs become invisible in fleet operations
Fleet managers deal with operational chaos daily. When truck #23 breaks down during morning dispatch, you need it fixed now. The work order gets processed, parts ordered, repairs completed. Everyone moves on to the next crisis.
The real damage happens in the gaps between systems. Your maintenance software tracks the repair. Your telematics system recorded the fault codes. The driver logged strange noises two weeks before the breakdown. The previous shop noted unusual wear patterns during the last PM service. Nobody connects these dots because the information lives in four different places.
A typical repeat failure cycle looks like this:
-
Month 1 Driver reports intermittent power loss on highway grades. Shop can't reproduce issue. No action taken.
-
Month 2 Check engine light appears. Local shop clears codes, replaces oxygen sensor. Problem "solved."
-
Month 3 Power loss returns, now with rough idle. Different shop replaces fuel injectors based on fault codes.
-
Month 4 Complete fuel pump failure during delivery run. Emergency tow, expedited repair, angry customer.
Total cost: $8,400 across four incidents. Root cause: contaminated fuel tank never addressed. This pattern repeats across your fleet because nobody's tracking the connections.
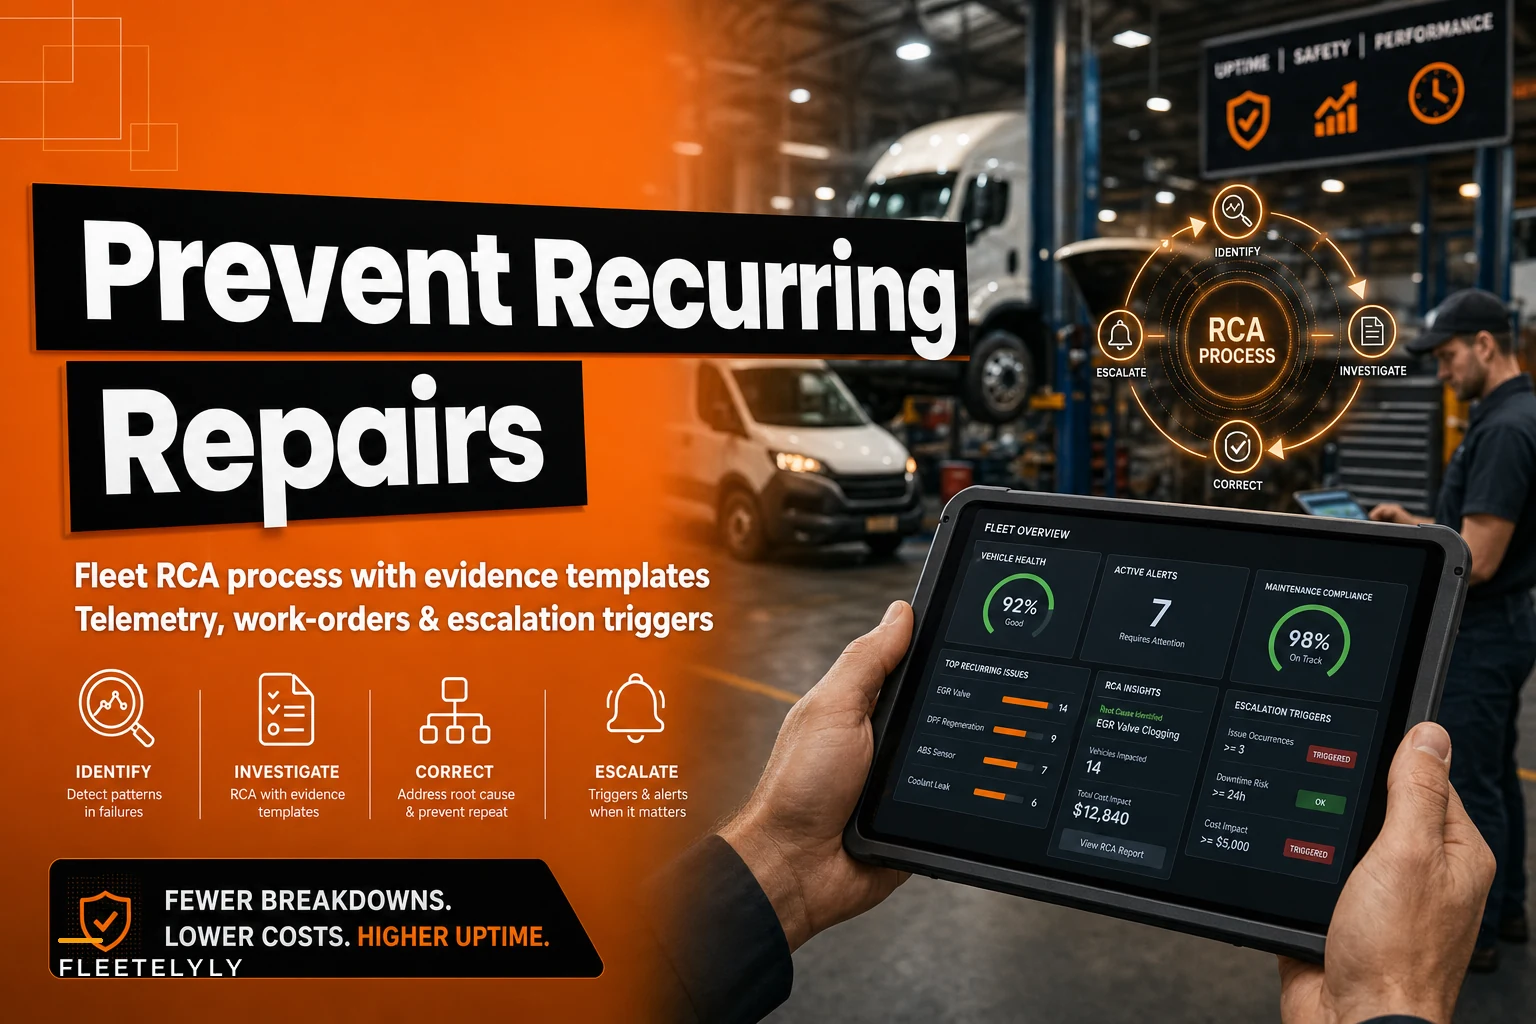
Evidence collection that actually prevents comeback repairs
Forget complex RCA frameworks. Real root cause analysis for fleet operations needs three things: the right data, captured consistently, reviewed systematically.
Prevent costly breakdowns with proactive maintenance.
Fleetelyly helps you schedule, track, and manage every vehicle service efficiently.
- Automated maintenance reminders
- Real-time service tracking
- Parts inventory integration
No credit card required
Evidence template for every repair over $500:
Pre-failure indicators:
-
Driver reports from previous 30 days
-
Telematics alerts and warnings
-
Previous repair history on same system
-
PM inspection notes highlighting wear patterns
Failure documentation:
-
Initial fault codes (not just active, but pending and historical)
-
Operating conditions when failure occurred (load, speed, temperature, grade)
-
Visual evidence (photos of failed components, wear patterns, contamination)
-
Fluid samples if hydraulic/engine/transmission related
Post-repair verification:
-
Test drive parameters and duration
-
Cleared vs remaining fault codes
-
Parts replaced with part numbers and suppliers
-
Technician notes on suspected contributing factors
The magic happens when you standardize this collection. Create a one-page form. Make it mandatory for repairs over your threshold. Review patterns weekly, not monthly.
Diagram of the evidence collection flow:
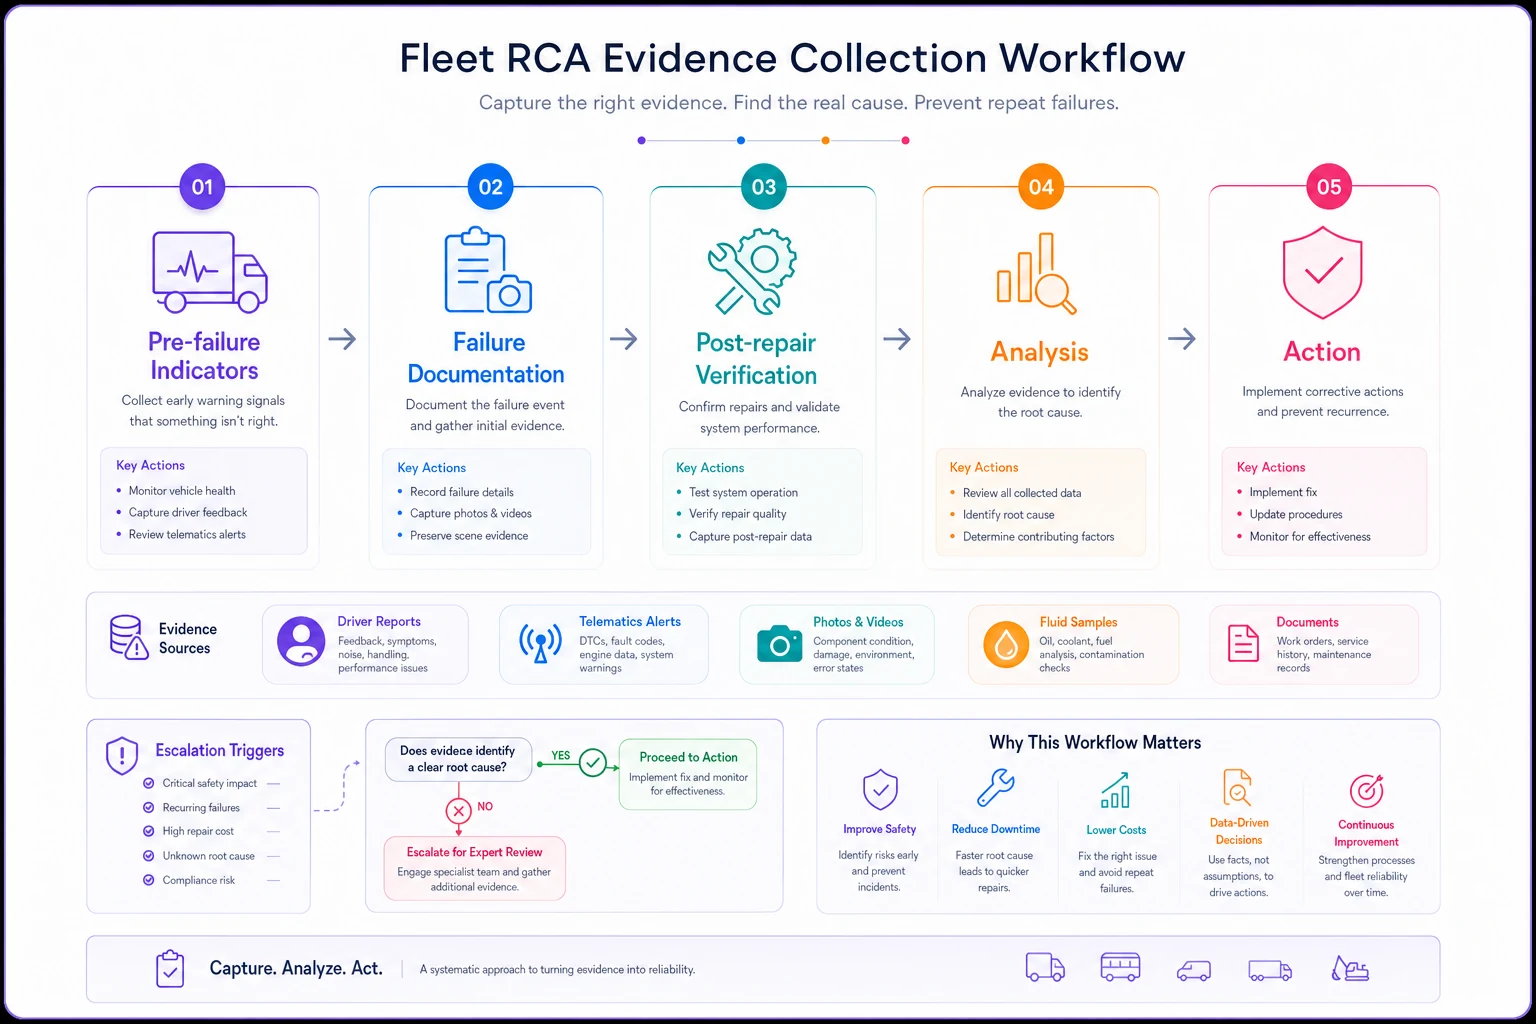
This shows the simple flow from early indicators to documented action and escalation.
Key telemetry points that reveal hidden failure patterns
Modern fleet telematics generates overwhelming data streams. For root cause analysis, you need specific indicators that predict repeat failures:
Engine/Powertrain:
-
Deviation from normal operating temperature patterns
-
Fuel trim adjustments beyond ±10%
-
Transmission slip rates during shifts
-
Turbo boost pressure variance
Braking System:
-
Brake application pressure inconsistencies between wheels
-
ABS activation frequency outside normal range
-
Temperature differentials across brake assemblies
Electrical:
-
Voltage drops during specific operations
-
Intermittent communication losses between modules
-
Battery discharge rates during shutdown periods
Track these metrics for 30 days before and after repairs. Repeat failures almost always show signs in this window—you just need to know where to look.
One distribution fleet started monitoring transmission temperature patterns after repairs. They discovered 40% of their "fixed" transmission issues showed abnormal temperature spikes within two weeks. The pattern revealed inadequate cooling system maintenance during transmission repairs. Simple fix, but invisible without targeted monitoring.
Work order analysis that catches problems before they spread
Your work order system probably captures hundreds of data fields. For root cause analysis, only a handful matter:
| Data Point | Why It Matters | Red Flag Threshold |
|---|---|---|
| Repair frequency by component/system | Identifies chronic issues | Same system 2x in 6 months |
| Labor hours vs standard time | Indicates complexity/difficulty | >150% of standard time |
| Parts failure rate by supplier | Quality control issues | >5% failure in 90 days |
| Technician reassignment rate | Training or diagnostic gaps | >30% of similar repairs |
| Comeback rate by shop | Process or quality problems | >8% within 30 days |
The patterns emerge when you track across vehicles, not just within them. That fuel pump failure might seem random until you realize six vehicles fueled at the same location all developed similar issues within weeks.
Building escalation triggers that stop problems from spreading
Waiting for patterns to become obvious means you've already lost money. Effective escalation happens before failures cascade across your fleet.
Level 1 triggers (Immediate review):
-
Same repair twice on one vehicle within 90 days
-
Similar failure on 3+ vehicles within 30 days
-
Repair cost exceeds 3x normal for that component
-
Safety-critical system with any repeat issue
Level 2 triggers (Management intervention):
-
Pattern affects >10% of similar vehicles
-
Total repeat repair costs exceed $10K in quarter
-
OEM warranty claims rejected for same issue repeatedly
-
Driver complaints continue after repair
Level 3 triggers (Fleet-wide action):
-
Systemic failure requiring recall consideration
-
Safety issue with potential regulatory impact
-
Vendor quality problem affecting multiple components
-
Design flaw requiring engineering consultation
Each trigger needs specific actions, not just awareness. Level 1 might mean enhanced monitoring. Level 2 could trigger vendor meetings or technician retraining. Level 3 might require fleet-wide inspections or accelerated replacement schedules.
Case study: How a 125-vehicle fleet cut repeat repairs by 60%
Regional food distributor, 125 refrigerated trucks, struggling with recurring refrigeration unit failures. Monthly repair costs averaging $45K, with 35% attributed to repeat issues.
The problem pattern:
Refrigeration units failing repeatedly, especially during summer months. Same units repaired multiple times for "different" issues—compressor, then condenser, then electrical. Each shop fixed the immediate problem without investigating why components kept failing.
Evidence collection revealed:
-
Drivers routinely overriding temperature controls for faster loading
-
PM services skipping condenser cleaning to save time
-
Refrigerant levels checked but quality never tested
-
Door seal inspections marked complete without actual testing
The root cause chain:
Dirty condensers → system running hot → refrigerant breakdown → oil contamination → compressor wear → electrical overload → cascading component failures
Intervention strategy:
-
Mandatory photo documentation of condenser condition during PM
-
Refrigerant quality testing every 6 months
-
Driver lockouts on temperature controls beyond set ranges
-
Thermal imaging of door seals quarterly
Results after 6 months:
-
Repeat refrigeration repairs dropped from 35% to 14%
-
Monthly repair costs reduced to $31K average
-
Zero food spoilage claims (down from 3-4 monthly)
-
PM service time increased by 12 minutes, saving hours of breakdown time
Pro Tip: Start RCA with your highest-cost repeat failures first. A successful resolution of one major pattern builds credibility and momentum for fleet-wide implementation.
The key wasn't fixing the refrigeration units—it was fixing the process that let problems compound.
Creating feedback loops between drivers, shops, and management
Most fleets have three separate conversations happening: drivers complaining to dispatch, shops explaining to management, management pressuring shops about costs. Nobody shares the full picture.
Build these feedback mechanisms:
Driver → Shop connection:
-
Simple pre-repair questionnaire
When did you first notice? What triggers it? Does it happen hot/cold/loaded/empty? Previous mechanics' explanations?
Shop → Management visibility:
-
Weekly pattern report
Not individual repairs, but emerging trends. Three similar failures become visible immediately, not after monthly reports.
Management → Driver communication:
-
Close the loop. When root cause is found, tell drivers what to watch for. They become early warning systems instead of complaint departments.
A fleet started a simple WhatsApp group for their five main shop managers. Within two months, they prevented four fleet-wide issues from spreading by sharing discoveries immediately. No complex software, just fast communication when patterns emerged.
Software automation for fleet RCA workflows
Tracking all this manually breaks down around 50 vehicles. The data exists—in maintenance software, telematics platforms, fuel cards, driver apps. But someone has to connect it all, analyze patterns, flag issues, track resolutions.
AI-powered operational software changes the game here. Not replacing your systems, but sitting on top of them to spot patterns humans miss.
Modern platforms can automatically:
-
Flag when repair patterns match previous root cause cases
-
Connect telematics anomalies to subsequent failures
-
Track parts failure rates across suppliers and batches
-
Generate evidence packages when triggers hit thresholds
-
Route escalations based on cost/safety/frequency rules
The real value isn't the automation—it's the consistency. Software doesn't forget to check patterns because it's busy with breakdowns. It doesn't miss connections because data lives in different systems.
A 200-truck fleet implemented automated RCA tracking and discovered their number-one repeat repair wasn't even on their radar. EGR cooler failures seemed random until the system connected them all to specific engine serial numbers from one production run. Saved $180K by proactively replacing units before failure.
Measuring success beyond reduced comeback rates
Everyone tracks comeback rates. But that's just one metric in a proper RCA program:
Leading indicators:
-
Days between repeat failures (should increase)
-
Percentage of repairs with complete evidence packages
-
Time from pattern detection to root cause identification
-
Driver report to repair correlation rate
Process metrics:
-
Escalation trigger response time
-
Cross-vehicle pattern detection rate
-
Vendor quality issues identified proactively
-
PM service adjustments based on RCA findings
Financial impact:
-
Repeat repair cost as percentage of total maintenance
-
Downtime hours from repeat failures
-
Warranty recovery from documented patterns
-
Cost avoidance from proactive replacements
Track trends, not absolutes. A fleet reducing repeat repairs from 30% to 25% saves more than one going from 10% to 8%, even though the percentage drop is smaller.
When RCA programs fail (and how to prevent it)
Data collection fatigue: Shops skip documentation when busy. Solution: Automate what you can, simplify what you can't. Better to collect three critical data points consistently than twenty sporadically.
Analysis paralysis: Too much data, no clear actions. Solution: Start with highest-cost repeat repairs only. Expand scope after proving value.
Lack of authority to act: Identifying root causes means nothing without power to address them. Solution: Define escalation authority upfront. Who can mandate fleet-wide inspections? Reject vendor shipments? Modify PM schedules?
Fixing symptoms, not causes: Pressure for quick fixes undermines RCA. Solution: Track both immediate repairs and root cause remediation separately. Celebrate preventing future failures, not just fixing current ones.
The compounding effect of systematic root cause elimination
Fixing root causes doesn't just prevent repeat repairs—it fundamentally changes your maintenance operation.
When you eliminate recurring issues, your shops spend less time on emergency repairs and more on preventive maintenance. Technicians get better at diagnosis because they see resolution patterns. Drivers trust that reported issues get properly fixed, so they report problems earlier. Parts inventory becomes predictable when you're not constantly stocking for emergency repairs.
A midwest trucking company tracked their journey: Year one, 31% repeat repairs. Year two, 18%. Year three, 11%. But the real win? Their mean miles between failures increased 47% over the same period. Not from better trucks or parts—from fixing problems correctly the first time.
Starting your fleet RCA process this week
Forget perfect systems. Start with one high-cost repeat repair. Build your evidence template around that specific issue. Track it for 30 days. Find the pattern. Fix the root cause. Document the win.
Then expand to your top three repeat offenders. Use the same template, same process, same escalation triggers. Let success build momentum.
Within 90 days, you'll have enough wins to justify broader implementation. You'll have proven that fixing root causes beats fixing symptoms every time.
The fleets still treating every breakdown as isolated incidents will keep bleeding money on repeat repairs. Meanwhile, you'll be preventing failures before they happen, armed with evidence that turns maintenance from reactive scrambling into proactive management.
Your drivers, technicians, and CFO will all thank you. But the real satisfaction comes from seeing that repeat repair percentage drop month after month, knowing you've finally broken the cycle that plagues most fleet operations.
Ready to maximize fleet uptime and reduce maintenance costs?
Join 2,000+ fleet managers using Fleetelyly to streamline maintenance workflows and improve vehicle reliability.