


Most fleets already know which suppliers frustrate them. Ask any parts manager and they'll rattle off two or three vendors who over-promise on lead times or ship the wrong SKU every third order. The problem isn't awareness—it's that this knowledge lives in someone's head instead of a system, so when the quarterly vendor review rolls around, everyone nods, nothing changes, and the same supplier keeps eating your uptime six months later.
A scorecard fixes that, but only if it's built around metrics that actually change how you buy, and only if every red score has a defined next step. A scorecard that produces a number nobody acts on is just a spreadsheet with extra steps.
This is a working template you can copy: the metrics that matter for fleets specifically, how to weight them, a dashboard layout people will actually read, and a remediation playbook that connects each failure mode to a procurement action.
Why generic scorecards fail in fleet parts procurement
Corporate procurement scorecards usually borrow from manufacturing supplier management. They obsess over pricing variance and PPM defect rates because those disciplines were built for high-volume production runs where you're buying the same 200 components forever.
Fleet parts don't work that way. You're buying across thousands of SKUs, many of them low-volume and criticality-tiered, from a mix of OEM dealers, aftermarket distributors, and a couple of local shops you call when you're desperate. A price-focused scorecard rewards the cheapest supplier and quietly punishes you when that supplier's brake rotors come back at a 9% return rate and your trucks are sitting idle.
What matters for a fleet is uptime protection. The scorecard has to answer one question: when I order a part, will it show up on time, correct, and not fail early? Everything else is secondary. A supplier who's 4% more expensive but never causes a bay to sit idle is worth more than the cheap one—but a naive scorecard will never show you that.
The other common failure is scoring at the vendor level when the pain is at the category level. A distributor might be excellent for filters and hoses and terrible for electrical components. Roll it all into one number and you lose the signal that would actually let you split the business intelligently.
The four metrics that actually matter
Keep the metric set small. Every extra metric dilutes the score and adds data-collection burden that eventually kills the whole program. Four core metrics carry most of the weight for fleet parts.
Prevent costly breakdowns with proactive maintenance.
Fleetelyly helps you schedule, track, and manage every vehicle service efficiently.
- Automated maintenance reminders
- Real-time service tracking
- Parts inventory integration
No credit card required
Fill rate (line-item, not order-level)
Fill rate is the percentage of ordered line items delivered complete on the first shipment. The detail most fleets get wrong: measure it at the line-item level, not the order level.
If you order 20 line items and one is backordered, order-level fill rate reads as 0% for that order (it wasn't complete) or gets fudged as "mostly filled." Neither is useful. Line-item fill rate tells you 95%—19 of 20—which is honest and lets you spot the one SKU category where a supplier consistently comes up short.
A common pattern: a supplier shows a strong 96% overall fill rate but their electrical and sensor lines run at 78%. That average hides the exact problem that's killing your diagnostic-heavy repairs.
Lead-time variance (not average lead time)
Average lead time is almost useless on its own. A supplier who reliably delivers in 5 days is far more valuable than one who averages 4 days but swings between 1 and 11.
Variance is what breaks your planning. When lead time is unpredictable, you can't set sane reorder points, you over-stock to compensate, and you still get caught short. Measure the standard deviation or, more simply, the spread between the 10th and 90th percentile delivery times.
If you're setting reorder points against these suppliers, lead-time variance is the input that matters most. This ties directly into how you build safety stock and min/max levels—we covered the mechanics of that in the spare-parts reorder policy for variable lead times, and the scorecard is where you get the variance data to feed those calculations.
Quality return rate (warranty + DOA + early failure)
This is the metric fleets under-track the most because the data is scattered across warranty claims, receiving rejections, and repeat-repair records.
-
DOA / receiving rejections — wrong part, damaged, obviously defective on arrival
-
Warranty returns — part failed within the warranty window
-
Early failures — part failed well before expected service life, whether or not it's warrantied
That third bucket is the one that hurts most and gets tracked least. A water pump that's supposed to last 100k miles failing at 30k doesn't always trigger a warranty claim, but it triggers a second repair, a second tow, and another round of downtime. If you're not counting early failures against the supplier, you're essentially rewarding the parts that quietly cost you the most.
Responsiveness on exceptions
When something goes wrong—a backorder, a wrong shipment, an urgent need—how fast and how well does the supplier respond? This one is partly qualitative, but you can make it measurable: time-to-acknowledge on an exception, and resolution time (credit issued, replacement shipped, or escalation offered).
Two suppliers can have identical fill and lead-time numbers, but one turns a stockout into a 20-minute problem and the other turns it into two days of silence. That difference doesn't show up anywhere else.
How to weight and score
Weighting depends on your fleet, but here's a starting distribution that works for most mixed fleets and a scoring band that keeps things simple.
| Metric | Weight | Green (3) | Yellow (2) | Red (1) |
|---|---|---|---|---|
| Line-item fill rate | 30% | ≥ 97% | 92–96% | < 92% |
| Lead-time variance (P90–P10 spread) | 25% | ≤ 2 days | 3–5 days | > 5 days |
| Quality return rate | 30% | < 1.5% | 1.5–3.5% | > 3.5% |
| Exception responsiveness | 15% | < 4 hrs / same-day fix | same day / next day | > 1 day |
Multiply each score by its weight, sum it, and you get a weighted score between 1.0 and 3.0. Anything above 2.6 is a keeper. 2.0–2.6 is on watch. Below 2.0 triggers active remediation.
One adjustment worth making: weight quality higher for safety-critical categories (brakes, steering, suspension) and fill rate higher for high-turn consumables. You can run the same template with two weighting profiles if your catalog splits cleanly.
A caution on thresholds—don't set them at levels no supplier can realistically hit. If every vendor lands in red, the scorecard loses credibility fast and people stop using it. Calibrate the bands against your actual data for the first quarter, then tighten.
Dashboard wireframe: what people actually look at
A scorecard nobody opens is dead weight. The dashboard has to surface the decision, not bury it in tables.
Top row — the leaderboard. Every active supplier, ranked by weighted score, color-coded green/yellow/red. This is the only thing most people need most of the time. One glance tells you who's drifting.
Second row — trend, not snapshot. A small sparkline per supplier showing the weighted score over the last six months. A supplier sitting at 2.5 is a very different situation depending on whether they're climbing from 2.0 or falling from 2.9. The trend catches problems before the absolute number does.
Third row — category heatmap. Suppliers down the side, part categories across the top, cells colored by performance. This is where you catch the "great at filters, terrible at electrical" pattern that a single vendor score hides completely.
Detail panel (click-through). For any supplier: the four metric scores, the raw numbers behind them, open exceptions, and any active remediation items with owners and due dates.
The mistake to avoid: building a beautiful dashboard on data that's manually assembled once a quarter. If someone has to spend two days pulling numbers before every review, the review will slip and then stop. The metrics need to flow from your work-order, receiving, and warranty records automatically, or the whole thing dies from maintenance fatigue. This is where fleet management platforms with AI-assisted data aggregation earn their keep—pulling fill and return data from receiving and repair records so the scorecard updates itself instead of depending on someone's Friday afternoon.
The diagram below shows the dashboard workflow and data flow.
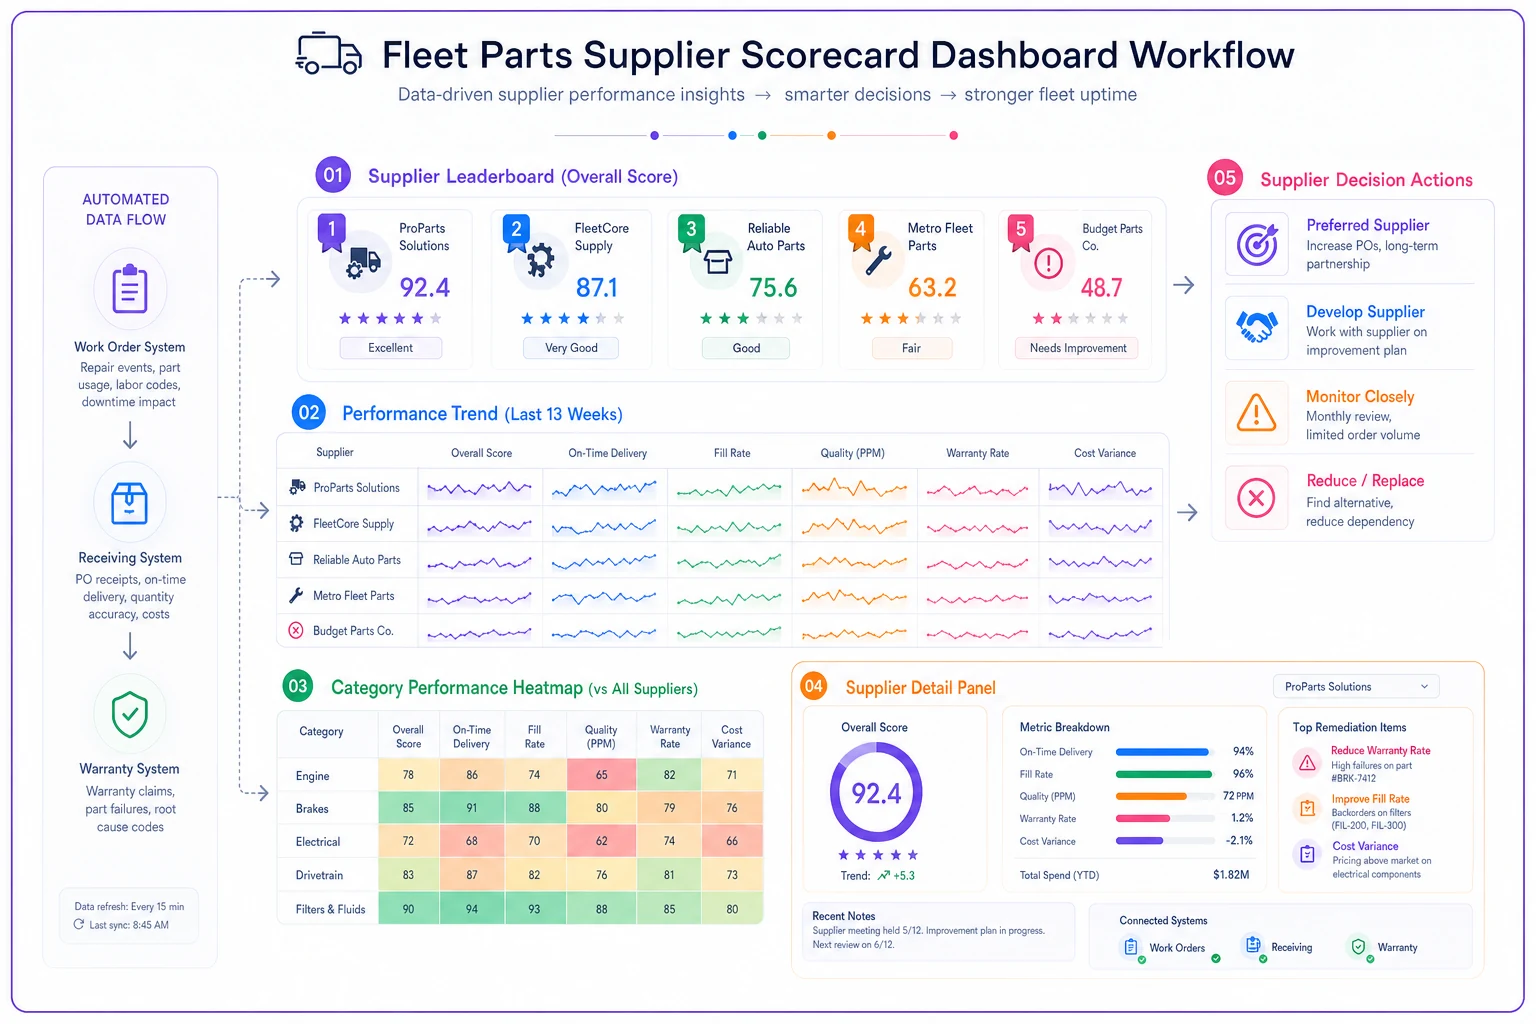
This needs to be a live, automated feed. If someone must manually assemble numbers before each review, the dashboard won't survive in practice.
The remediation playbook: connecting red scores to procurement actions
This is the part that separates a real program from a spreadsheet. Every failure mode gets a defined response. Without it, you'll flag a bad supplier and then do nothing, because nobody decided in advance what "something" actually looks like.
-
Fill rate red, everything else green — Usually a stocking or allocation problem, not a fundamental one. Action: request the supplier's stocking commitment for your top 50 SKUs, and set up a consignment or VMI arrangement for high-turn items. If they won't commit, dual-source the specific SKUs that miss.
-
Lead-time variance red — The supplier is unpredictable, which poisons your planning. Action: raise safety stock on affected SKUs as a stopgap, then require the supplier to provide firm lead-time windows in writing. If variance doesn't tighten within a quarter, shift the variance-sensitive, criticality-tier-one parts to a more predictable source.
-
Quality return rate red — Highest priority, especially on safety categories. Action: pull the specific failing SKUs and check whether it's one product line or systemic. Demand a corrective action report for repeated failures. Freeze new orders on the failing line and qualify an alternate before you resume. Do not average this problem away.
-
Responsiveness red, metrics otherwise fine — Often a relationship or account-coverage issue. Action: escalate to a named account rep, set a written expectation on exception response time, and re-score in 60 days. This one is frequently fixable with a single conversation—but only if the data forces the conversation to happen.
-
Multiple reds / declining trend across categories — This supplier is a structural risk. Action: begin a controlled wind-down. Move criticality-tier-one parts first, keep low-risk consumables while you transition, and don't cut them off entirely until the replacement is proven on real orders.
The key discipline: assign an owner and a due date to every remediation item. "We'll talk to the supplier" with no owner and no date is where these programs go to die.
A real scenario
A regional delivery fleet running around 140 vehicles had two primary aftermarket distributors and treated them as interchangeable because pricing was within a few percent of each other. No scorecard—just a general sense that both were "fine."
When they finally split the numbers by category, fine didn't hold up. Distributor A ran a solid 96% line-item fill and under 2% returns across the board. Distributor B looked comparable overall—about 94% fill—but their brake and suspension lines were returning at roughly 7%, and lead-time variance on those categories swung as wide as 9 days. Those early brake failures were driving repeat repairs and a handful of roadside events that never got traced back to the part source.
The remediation was straightforward once the data existed. They froze new brake and suspension orders with Distributor B, moved those categories to Distributor A, and kept B on the consumable lines where it performed fine. Over the next two quarters, repeat brake repairs on the affected vehicles dropped noticeably, and parts-related downtime in that category fell by roughly a third. Nothing changed about either vendor's pricing. What changed was that the fleet stopped buying the wrong parts from the wrong supplier because the scorecard finally made the pattern visible.
When a formal scorecard makes sense—and when it doesn't
When it's worth it: You're running enough volume across enough suppliers that patterns are real but invisible. If you have more than three active parts suppliers and a catalog in the thousands of SKUs, you're probably leaving uptime on the table without one.
When it's overkill: A small fleet with one primary supplier and a handful of SKUs doesn't need a weighted scoring model. You'll know your supplier's problems by name. Building a dashboard for a two-vendor operation is effort better spent elsewhere.
Who should not do this: Anyone who isn't prepared to act on the scores. A scorecard that produces red flags and gets ignored is worse than no scorecard—it trains your team to distrust the data and gives suppliers evidence that your reviews have no teeth. If you can't commit to the remediation playbook, don't build the scorecard yet.
Getting started without boiling the ocean
You don't need clean historical data to begin. Start scoring forward from today on your top 10 suppliers and your criticality-tier-one categories only. That covers most of your uptime risk with a fraction of the effort.
Run it for one quarter to calibrate your thresholds against reality, then expand coverage and tighten the bands. The first version will be rough—fill-rate data will have gaps, early-failure tracking will be incomplete. That's fine. A rough scorecard that drives one good sourcing decision beats a perfect one that never ships.
Start scoring your top 10 suppliers forward from today so you get actionable signals quickly without historical-cleanup work.
The whole point is to convert the frustration your team already feels into a number, and the number into an action. Suppliers respond to being measured, especially when they can see they're being compared and that low scores actually move business away. The scorecard isn't paperwork—it's leverage.
The whole point is to convert the frustration your team already feels into a number, and the number into an action. Suppliers respond to being measured, especially when they can see they're being compared and that low scores actually move business away. The scorecard isn't paperwork—it's leverage.
Ready to maximize fleet uptime and reduce maintenance costs?
Join 2,000+ fleet managers using Fleetelyly to streamline maintenance workflows and improve vehicle reliability.