



Most predictive maintenance pilots don't fail because the models are bad. They fail because nobody set them up to be measurable. Six months in, someone asks "did it work?" and the honest answer is "we think so, maybe." You can point to a few catches, a couple of avoided roadside failures, and a dashboard that says everything is green. But you can't separate the effect of the PdM system from the new technician you hired, the mild winter, or the fact that you quietly started doing more PMs around the same time.
That's the whole problem. Without a clean experiment, your ROI number is a story, not a measurement. And stories get killed the moment finance gets nervous about renewal costs.
This is a playbook for designing a PdM pilot you can actually defend — control groups, the handful of metrics that matter, the statistical sanity checks that keep you honest, and the decision gates that tell you when to scale, hold, or pull the plug.
Why most PdM ROI numbers fall apart under scrutiny
The usual approach is a before/after comparison. Run the fleet for a year, turn on predictive maintenance, run it another year, compare downtime. Clean on paper, useless in practice.
The problem is confounding. A year is long enough for a dozen things to change — parts prices, driver behavior, route mix, a new shop manager, seasonal failure patterns. When your "after" period looks better, you have no real way to attribute how much of that improvement came from PdM versus everything else that shifted. This gets messy fast when the fleet also rolled out a new PM schedule or swapped telematics providers in the same window. Now the PdM effect is tangled up with two or three other changes, and nobody can really untangle it.
The second failure mode is cherry-picking. Vendors love showing the five units where a bearing alert saved a catastrophic failure. Those saves are real, but they're anecdotes. For every dramatic catch there might be fifteen alerts that led to a teardown, found nothing, and burned two hours of bay time. A pilot that only counts the wins isn't an ROI study — it's a highlight reel.
The fix for both problems is boring and effective: a concurrent control group. You compare units running PdM against comparable units that aren't, over the same time period. Same weather, same parts market, same shop culture. Whatever's left over is a much cleaner read on what the system actually did.
Designing the control group so the comparison is fair
Randomization is the gold standard, but a pure coin-flip across your fleet is rarely practical. Route constraints, depot assignments, and asset classes can't always be freely shuffled. So you work with stratified assignment instead.
Prevent costly breakdowns with proactive maintenance.
Fleetelyly helps you schedule, track, and manage every vehicle service efficiently.
- Automated maintenance reminders
- Real-time service tracking
- Parts inventory integration
No credit card required
Split your fleet into buckets where units are genuinely comparable, then assign treatment and control within each bucket. A reasonable stratification for a mixed fleet:
-
Asset class and age band (e.g., Class 8 tractors, 3–5 years old)
-
Duty cycle (long-haul vs. regional vs. stop-and-go urban)
-
Baseline failure rate (units that already break a lot vs. reliable ones)
Within each stratum, split roughly 50/50. You don't need perfect balance — you need comparable balance. A common mistake is putting all the new trucks on PdM and leaving the old beaters as control. Of course the PdM group looks better; they're newer. That's not uplift, that's a selection artifact.
Say you've got 120 regional delivery vans you want to pilot. You might land on something like:
| Stratum | Total units | PdM (treatment) | Control |
|---|---|---|---|
| 2–3 yr, low-failure | 40 | 20 | 20 |
| 2–3 yr, high-failure | 30 | 15 | 15 |
| 4–6 yr, low-failure | 28 | 14 | 14 |
| 4–6 yr, high-failure | 22 | 11 | 11 |
Now when you compare downtime, you're comparing like against like within each band, then rolling it up. The high-failure old vans in treatment get compared to high-failure old vans in control — not against the pristine new fleet.
Lock the assignment in your asset management system and require a logged exception to move any unit during the pilot.
One more thing people consistently forget: lock the assignment and don't touch it. The temptation to "just move this one problem truck onto PdM because it's acting up" destroys the experiment. That's exactly the kind of selection that biases your result. Problem trucks drifting into the treatment group make PdM look worse than it is; drifting into control makes it look better. Either way, you've poisoned the comparison.
The metrics that actually move the ROI number
You don't need thirty KPIs. You need three or four that connect directly to money, measured the same way across both groups.
-
1. Unplanned downtime hours per unit per month. This is the headline. Scheduled maintenance doesn't count — the whole point of PdM is converting surprise failures into planned work. Measure hours a unit is out of service due to an unplanned event.
-
2. MTTR for unplanned repairs. Mean time to repair. PdM should shorten this because you know what's wrong before the truck rolls in, so parts are staged and the diagnosis is half-done. If MTTR isn't moving, either your alerts aren't actionable or your shop isn't using the lead time.
-
3. Parts cost per unit per month. This one's double-edged. Good PdM catches small failures before they cascade — a $180 sensor swap instead of a $2,400 component failure. But over-aggressive alerting drives more part replacements, some unnecessary. Watch this number closely; it tells you whether your alerting is tuned or trigger-happy.
-
4. Catastrophic/roadside failure rate. Low-frequency, high-cost events — tow bills, missed deliveries, overtime. These are rare enough that you treat them separately rather than folding them into the main average.
If you had to rank what finance cares about: unplanned downtime first (it's the direct uptime story), then parts cost (it's the direct expense story), then MTTR. Roadside failures are the emotional win but statistically the noisiest — don't build your case on them alone.
A quick note on measurement discipline. Define each metric before the pilot starts, in writing, including edge cases. Does a repair that spans a weekend count the closed days as downtime? Is a tow-in with a two-day parts wait one event or two? If you decide these rules mid-pilot, you'll unconsciously define them in whatever direction makes the result look good. And if your telematics signals and work-order feeds aren't trustworthy in the first place, the whole analysis is built on sand — the issues in predictive maintenance model operations and the MLOps pitfalls behind them will quietly wreck your numbers before you even get to the statistics.
Statistical sanity checks that keep you honest
You don't need a PhD here. You need enough rigor to avoid fooling yourself. Three checks cover most of it.
Check your baseline balance first. Before you look at any results, confirm the treatment and control groups actually started similar. Compare their pre-pilot downtime, age, and mileage. If the groups were already different on day one, any "uplift" might just be that pre-existing gap — and it's an easy thing to miss if you're eager to see the pilot work.
Account for how noisy the numbers are. Downtime per unit is a jumpy metric. One blown transmission can swing a small group's monthly average hard. With 60 units per group over six months you have enough observations to see a real difference, but a 5% improvement could easily be noise. A rough working rule: if the gap between groups is smaller than the month-to-month swing within a single group, don't trust it yet. You want the signal to clearly stand above the normal wobble.
Watch for the stuff that quietly breaks the experiment:
-
Spillover — if the same mechanics work on both groups and start applying PdM-learned habits to control units, your control is contaminated and the measured uplift shrinks. That's actually a good operational sign but a bad experimental one.
-
Attrition — units that get totaled, sold, or pulled mid-pilot. If failing units leave the control group faster because they got replaced, control looks artificially healthy.
-
The one-big-event skew — a single roadside catastrophe in the control group can make PdM look like a miracle. Report your results both with and without the single worst event in each group. If the conclusion flips, you don't have a robust result, you have one lucky data point.
Pre-commit to these checks. Write them down before you see results. It's surprisingly easy to rationalize dropping an "outlier" that happens to hurt your preferred conclusion.
A real scenario: regional parcel fleet, 90-unit pilot
A regional parcel operation ran a six-month pilot on part of a roughly 180-van fleet. They split 90 units into PdM and kept 90 as control, stratified by age and route type. They'd been burned before by a vendor demo full of hand-picked saves, so this time they insisted on a concurrent control group.
Going in, both groups were running around 6–7 unplanned downtime hours per van per month. Parts spend sat near $210–$240 per van monthly. Nothing fancy, just a tired mid-life fleet.
After six months, the PdM group landed at roughly 4.5 hours of unplanned downtime per van, versus about 6.5 in control. MTTR on unplanned jobs came down noticeably in the treatment group because the shop was staging parts off the alerts instead of diagnosing cold. Parts cost was the interesting one — it rose slightly in the PdM group at first, close to $250, because early alerting was driving some precautionary replacements. Once they tuned the alert thresholds around month four, it settled back down and ended a bit below control.
When they ran the sanity checks, the downtime gap held up even after removing the single worst roadside event from each group. That's what gave finance confidence it wasn't a fluke. The net came out somewhere in the range of $90k–$120k of annualized value across the piloted vans once they factored in downtime, avoided tows, and the parts shift — comfortably above the subscription and integration cost. Not a dramatic headline number, but a defensible one, which mattered far more at renewal time.
Rollout decision gates
Don't make scale-or-kill a single meeting at the end. Build gates into the pilot so you catch problems early and don't waste six months on a system that's clearly not landing.
-
Gate 0 — Data readiness (before launch). Can you actually measure your four metrics cleanly for both groups? If work-order data is a mess or downtime isn't logged consistently, fix that first. Running a pilot on unmeasurable data is just burning calendar.
-
Gate 1 — Alert actionability (week 4–6). Are alerts leading to real, useful shop actions, or are techs ignoring them? If the false-positive rate is drowning the real catches, stop and tune before you waste technician trust. A pilot where mechanics have learned to ignore the system is already dead.
-
Gate 2 — Early directional signal (month 3). Is treatment trending better than control on downtime, even if it's not yet statistically solid? You're not deciding ROI here — you're checking you're not clearly going the wrong way.
-
Gate 3 — Full ROI readout (month 6). Run all the metrics and sanity checks. Decide: scale, extend, or stop.
For Gate 3, be explicit about thresholds before you see the data:
-
Scale if unplanned downtime uplift is clear, survives the outlier-removal check, and net value comfortably beats program cost.
-
Extend if the direction is right but the signal is still inside the noise — give it another quarter rather than guessing.
-
Stop if there's no meaningful downtime gap after sanity checks, or if parts cost blowup from over-alerting eats the downtime savings.
These gates aren't bureaucracy. They're the thing that stops you from riding a failing pilot all the way to a wasted budget cycle.
Here's a simple visual of the gates and decision branches.
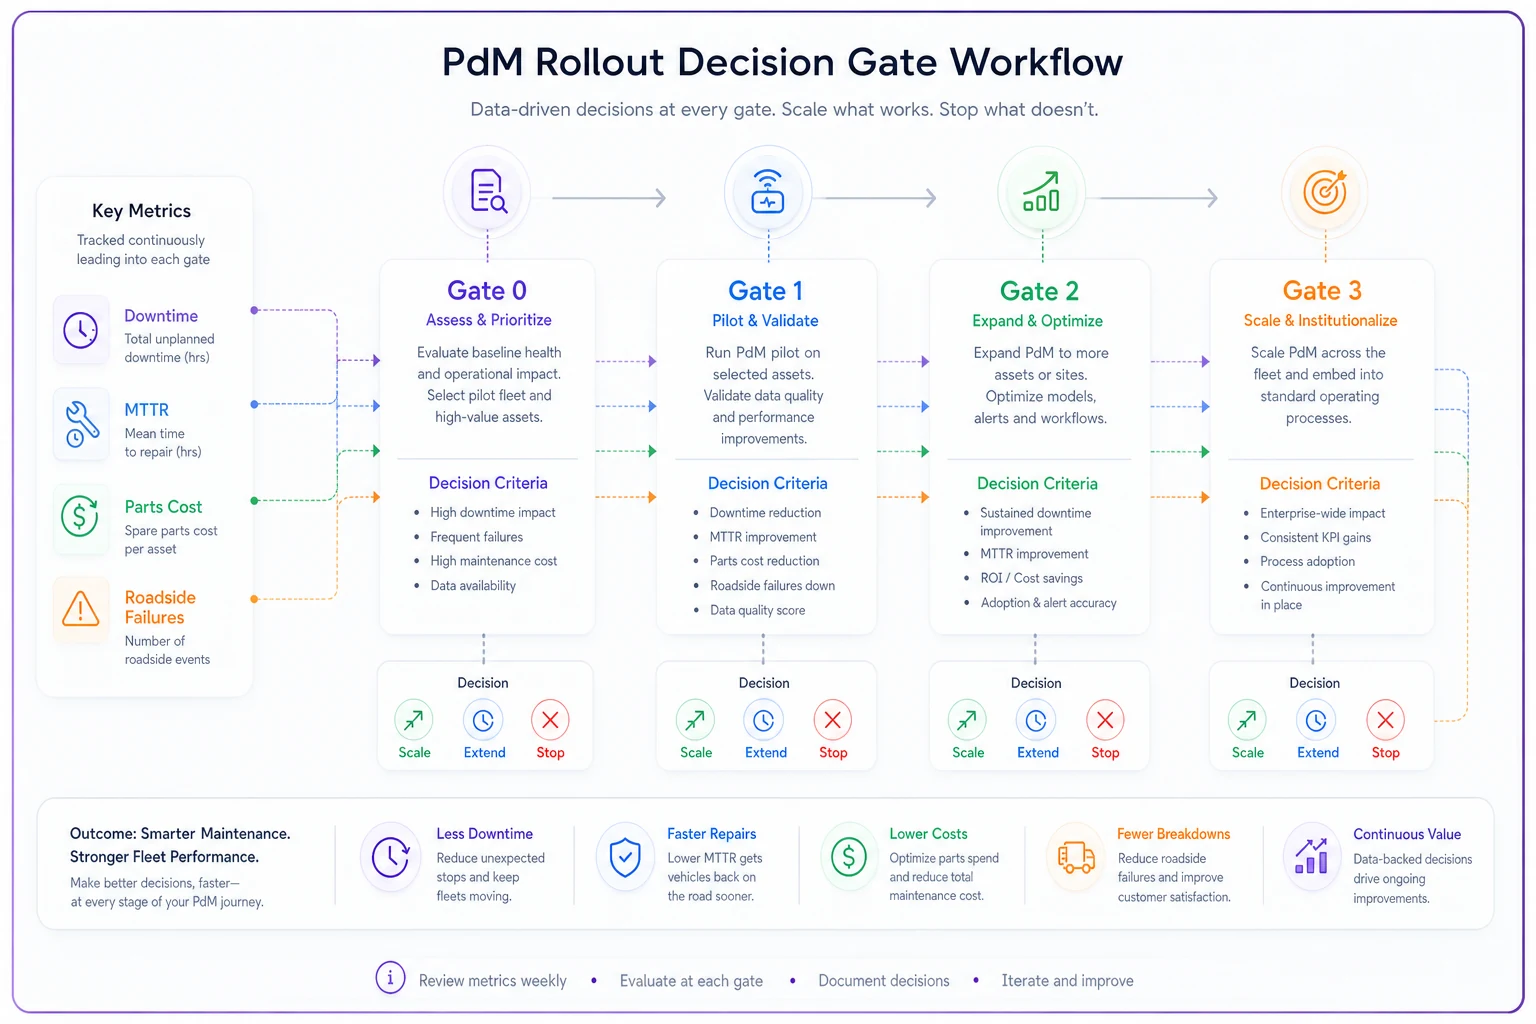
Use the visual to align stakeholders on when to stop, extend, or scale based on pre-committed checks.
When this rigor is worth it — and when it's overkill
The full control-group approach makes sense when you've got enough units to split into statistically meaningful groups (realistically 40+ per arm), a subscription cost big enough that finance will push back, and a mixed fleet where "it felt better" won't survive a budget review.
It's overkill if you're running ten trucks. With a tiny fleet you don't have the statistical power for a clean comparison anyway — you're better off tracking individual failure cases qualitatively and making a judgment call. Forcing a formal experiment onto a handful of assets just produces a precise-looking number that's actually noise.
One situation where none of this works as described: anyone whose underlying maintenance data isn't trustworthy yet. If your downtime logging is inconsistent or your work orders don't reliably tag planned vs. unplanned, a control group won't save you — you'll just produce a clean comparison of dirty numbers. Fix the data foundation first, then run the experiment.
The point
A predictive maintenance pilot's ROI is only as good as the experiment behind it.
A concurrent, stratified control group, three or four money-linked metrics measured the same way across both arms, sanity checks you commit to in advance, and staged decision gates — that's the difference between a number you can defend and a vendor anecdote finance will shred at renewal. Build the measurement before you build the dashboard, and the ROI question mostly answers itself.
Ready to maximize fleet uptime and reduce maintenance costs?
Join 2,000+ fleet managers using Fleetelyly to streamline maintenance workflows and improve vehicle reliability.