



Most fleet modernization requests die in the same place: a conference room where the CFO can't figure out why "lower MTTR" should translate into a seven-figure capital outlay. The maintenance team walks in with uptime charts and fault-code dashboards. The finance team walks in wanting NPV, payback period, and a risk register. Both sides leave frustrated, and the request gets pushed to "next budget cycle" — which somehow never arrives.
The problem isn't the numbers. It's the translation layer. A fleet modernization investment case that actually works has to speak two languages simultaneously: the operational reality of your shop floor, and the financial logic your board uses to allocate capital against a dozen competing priorities. Get the translation right and you stop pitching projects — you start presenting investments with returns.
This is the full system for doing that: what the deck should contain, how decision gates work, how to build NPV/IRR workups from maintenance data you already have, and how to frame risk so finance trusts your numbers instead of reflexively discounting them.
Why maintenance teams lose the funding argument
There's a pattern that shows up constantly. A fleet manager builds a genuinely strong operational case — telematics-driven diagnostics, a modern maintenance platform, maybe depot electrification. The data is solid. Downtime is costing real money. And yet the proposal reads like a wish list because it never connects operational metrics to the three things a board cares about: cash, risk, and timing.
-
KPIs presented as achievements, not inputs. A board doesn't fund a lower MTTR. It funds the cash flow that a lower MTTR produces. If your slide ends at the operational metric, the financial brain in the room has to do the translation itself — and they usually translate it as "unclear, deprioritize."
-
No baseline the finance team trusts. If your current-state numbers can't be tied back to the general ledger, every projection gets discounted. Normalizing your operational data before you present it matters more than any single ROI figure.
-
One giant ask instead of gated decisions. A $2M all-or-nothing request terrifies a board. A staged commitment with clear go/no-go points gives them a way to say yes without betting the whole budget.
-
Risk treated as an afterthought. When the risk section is a single bullet that says "implementation risk — medium," finance assumes you haven't thought it through. They're usually right.
The fix is structural. You build the case the way a finance team builds any capital decision — and you do the translation for them so there's nothing left to misinterpret.
The deck structure that gets a yes
A board-ready modernization deck is not your operational review with nicer fonts. It's a decision document. The goal is to walk an executive from "why now" to "here's the return" to "here's how we de-risk it" in about twelve slides. Anything longer and you're running a seminar, not asking for a decision.
Prevent costly breakdowns with proactive maintenance.
Fleetelyly helps you schedule, track, and manage every vehicle service efficiently.
- Automated maintenance reminders
- Real-time service tracking
- Parts inventory integration
No credit card required
-
The problem in dollars, not metrics. Open with the cost of the status quo. Not "aging fleet" — but "our 2016–2018 diesel units are generating roughly $340k–$400k a year in unplanned repairs above the fleet median, and that figure grows around 12–15% annually as those units age."
-
The decision being asked for. State it plainly on slide two. Dollar amount, timeline, and what the board is approving. No surprises later.
-
Current-state baseline. Normalized, GL-reconciled numbers. This slide earns your credibility for the rest of the deck.
-
The modernization approach. What you're actually doing — the mix of vehicle replacement, platform, telematics, process change.
-
Financial return (NPV / IRR / payback). The core slide. We'll break this down below.
-
Decision gates. How the money is released in stages against measurable criteria.
-
Risk register and mitigations. The specific things that could go wrong and what you've built in to handle them.
-
The ask and the timeline. Close by restating the decision and the first gate.
The slides in between — sensitivity analysis, phasing detail, assumptions appendix — support the story but don't lead it. A common mistake is front-loading technical detail. Executives want the conclusion first and the evidence available on demand, not the other way around.
Sample slide: the problem in dollars
> "Our mid-life diesel segment (41 units) ran about $410k in maintenance last year versus $265k for a comparable modern segment. That $145k gap is structural — it's driven by parts obsolescence, longer repair cycles, and higher failure frequency. Left alone, this segment costs us roughly $1.9M–$2.2M over the next four years before we even account for downtime revenue loss."
Notice what that does. It converts an operational truth into a cash figure, ties it to a time horizon, and sets up the investment as a way to avoid a known cost — not just chase a hypothetical benefit. Avoided cost is the single most persuasive frame in a capital pitch because it's grounded in money you're already spending.
Building the NPV and IRR workup from maintenance data
This is the part maintenance teams tend to outsource to finance and then lose control of. You shouldn't. The assumptions behind the model are the operational case, and if you don't own them, someone who doesn't understand your shop will set them for you.
The workup has four building blocks:
1. Cash outflows (the investment). Capital cost of vehicles or equipment, platform and software licensing and implementation, training, and transition costs. Be honest about the messy stuff — data migration, parallel running, temporary productivity dips. Finance respects a model that admits transition friction.
2. Cash inflows (the returns). This is where you translate operational gains into money:
-
Reduced maintenance spend (parts + labor) per vehicle
-
Recovered uptime converted to revenue-per-vehicle-day
-
Fuel or energy savings
-
Lower warranty leakage and reduced unplanned repairs
-
Residual value improvements
3. The discount rate. Use your company's actual cost of capital. Don't guess. If rates have moved, your discount rate moved with them, which directly changes whether a project clears the hurdle. Tying maintenance signals to the right CAPEX logic is something we covered in depth in the lifecycle cost & investment framework for mixed fleets, and the same discipline applies here.
4. The time horizon. Match it to the asset life — typically 5–7 years for fleet modernization. A horizon that's too short makes almost any capital project look bad; one that's too long looks like you're hiding a weak payback.
Here's a simplified version of how the translation looks in practice for a mid-sized segment:
| Line item | Year 0 | Year 1 | Year 2 | Year 3 | Year 4 |
|---|---|---|---|---|---|
| Capital outlay | ($1,450,000) | — | — | — | — |
| Maintenance savings | — | $180,000 | $205,000 | $220,000 | $230,000 |
| Recovered uptime (revenue) | — | $120,000 | $140,000 | $150,000 | $155,000 |
| Energy/fuel savings | — | $65,000 | $70,000 | $72,000 | $74,000 |
| Transition costs | ($90,000) | ($40,000) | — | — | — |
| Net cash flow | ($1,540,000) | $325,000 | $415,000 | $442,000 | $459,000 |
Run that against a cost of capital around 9–10% and you land on a positive NPV with an IRR comfortably above hurdle and a payback inside year four. The exact figures matter less than the structure: every inflow traces back to a specific operational metric you can defend when someone challenges it.
One mistake worth flagging here: false precision. A model with returns projected to the dollar four years out signals naivety, not rigor. Use ranges in your narrative and point estimates in the model, and always show a sensitivity case — what happens if maintenance savings come in 25% below plan? If the project still clears the hurdle at that downside, say so. That single slide does more to build trust than any optimistic base case.
Decision gates: how to make a big ask feel safe
No board wants to write one check for the full modernization program and hope for the best. Decision gates solve this by breaking the commitment into tranches, each released only when the prior stage hits defined criteria. This is where operational discipline and financial governance actually meet — and it's the thing that most often turns a "no" into a "let's start phase one."
-
Gate 0 — Approval to pilot. Releases a small slice of capital (often 10–15%) to validate assumptions on a limited vehicle set. Criteria to pass: data baseline confirmed, pilot cohort selected, success metrics agreed.
-
Gate 1 — Pilot validation. Releases the next tranche only if the pilot hits pre-agreed targets — say, maintenance cost reduction within a defined band and uptime improvement above a floor.
-
Gate 2 — Scaled rollout. Full capital release, contingent on pilot results holding at scale and no major risk flags triggering.
-
Gate 3 — Steady state and review. Post-implementation audit comparing actuals to the model, feeding lessons back into the next cycle.
If you want the full mechanics of staged rollout with measurable checkpoints, the phased roadmap for fleet maintenance modernization with quarterly gates lays out how to sequence the operational work behind each financial gate.
Here's a simple visual of how staged gates and feedback loops fit together:
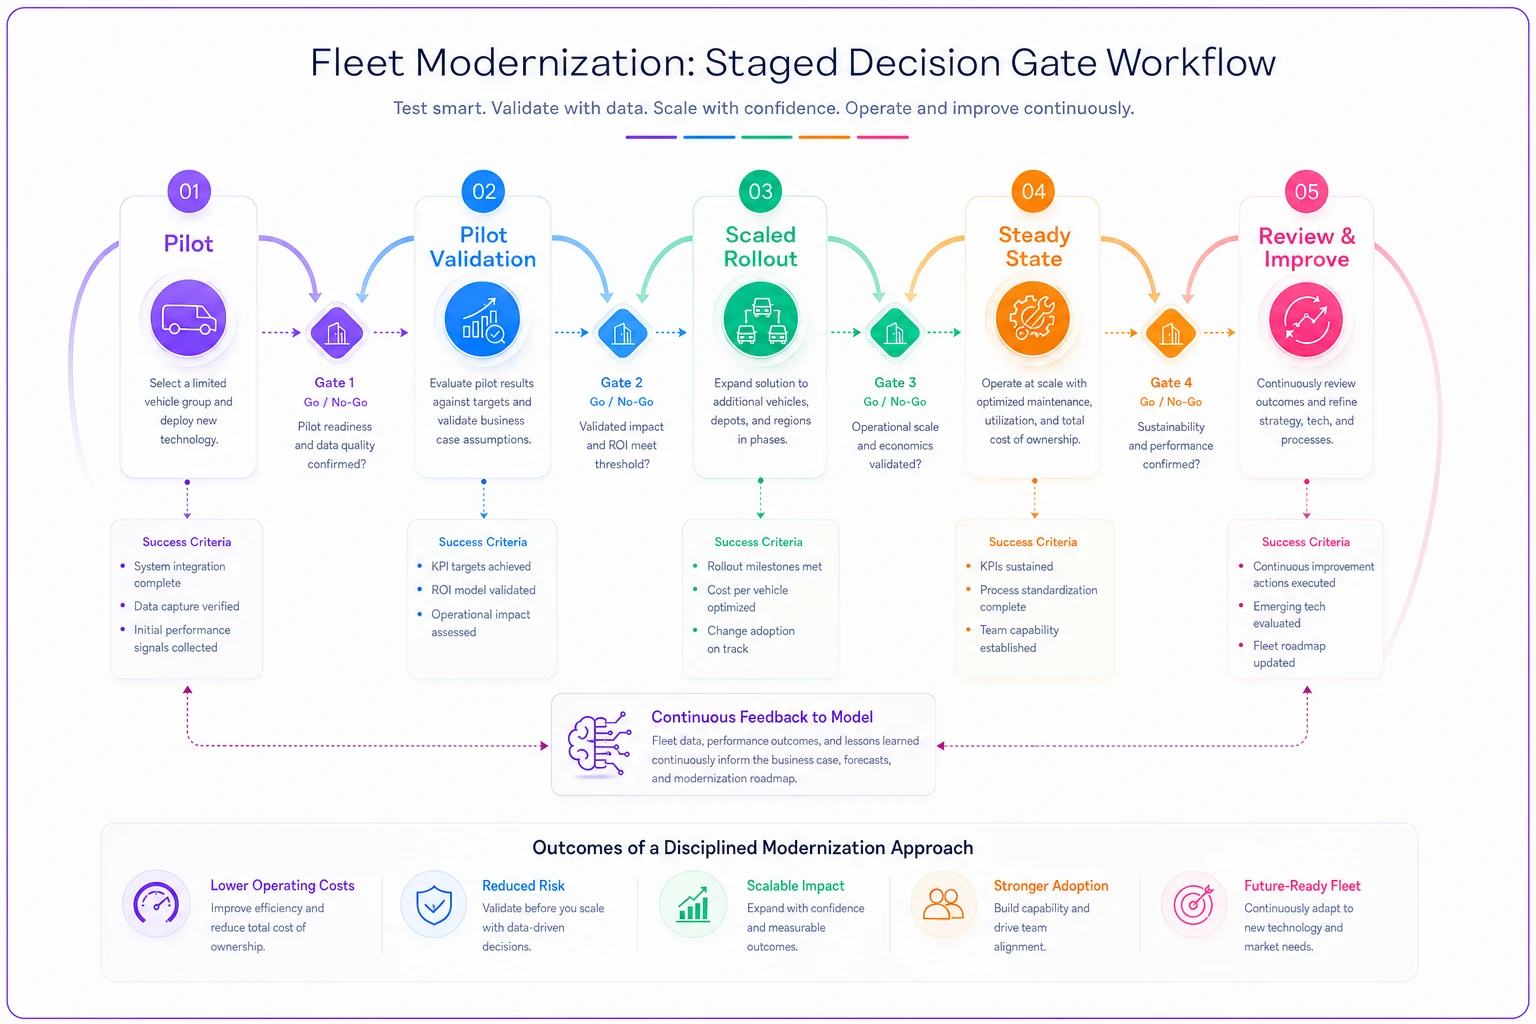
Tie each gate's pass/fail criteria to a single numeric metric finance can verify quickly.
The power of gating is that it reframes the conversation. You're no longer asking for $1.5M on faith. You're asking for $200k to prove the thesis, with a built-in off-ramp if the numbers don't hold. For a risk-averse board, that structure is often the difference-maker.
Gating criteria checklist
Gating criteria checklist
-
[ ] A specific dollar amount released
-
[ ] 2–4 measurable pass/fail criteria (not vague "progress" language)
-
[ ] A named owner accountable for the decision
-
[ ] A defined review date
-
[ ] A documented off-ramp — what happens if the gate fails
-
[ ] A clear link between the gate's criteria and the NPV model's assumptions
That last point is the one teams forget. If your Gate 1 criteria don't map directly to the assumptions in your financial model, you've created two parallel systems that will contradict each other by month six.
Framing risk so finance trusts your numbers
A risk slide that says "medium risk, will monitor" tells a CFO you haven't done the work. A risk register that names specific failure modes, quantifies their impact, and pairs each with a concrete mitigation tells them you've already stress-tested your own case. That's the difference between a plan that gets discounted and one that gets funded.
Execution risk — implementation delays, data migration problems, adoption resistance on the shop floor. Mitigation: phased rollout, parallel running, training built into the capital ask.
Financial risk — returns come in below projection. Mitigation: the downside sensitivity case, the gating structure that caps exposure, and a clear trigger for pausing further spend.
Supply and timing risk — vehicle or parts lead times, charging infrastructure dependencies for EV components. Mitigation: pre-ordered long-lead items, supplier commitments, buffer in the timeline.
Operational continuity risk — service disruption during transition. Mitigation: staged cutover, retained capacity, rollback plan.
The insight most people miss: presenting your own downside case strengthens your position. When you show the board the scenario where savings underperform by a quarter and the project still clears the hurdle, you remove the finance team's biggest unspoken objection — that your numbers are optimistic. You've already assumed they are, and the case holds anyway.
When this makes sense — and when it doesn't
When it makes sense:
-
The ask crosses your organization's CAPEX approval threshold
-
The modernization touches multiple vehicle segments or depots
-
There's a multi-year payback that needs NPV framing to look right
-
Competing priorities mean you have to justify this against other capital uses
When it's overkill:
-
Routine replacement within an already-approved lifecycle budget
-
Small operational tooling that fits inside an operating budget
-
Emergency replacements where the decision is forced by failure, not choice
Who should not lead this alone: If your current-state maintenance data isn't normalized and reconcilable to the general ledger, don't start with the investment case — start with the data. A beautifully formatted NPV built on numbers finance can't verify will do more harm than good. Fix the baseline first, then build the case on top of it.
A real scenario: urban delivery fleet, mid-life diesel segment
A regional last-mile delivery operation running around 150 vehicles had a mid-life diesel segment of roughly 40 units generating disproportionate maintenance cost — about $400k a year against a fleet median that suggested it should be closer to $260k. Downtime on that segment was pulling vehicles out of rotation during peak delivery windows, forcing rentals at premium rates.
The first attempt at a modernization request failed. It was essentially an operational review: fault-code trends, MTTR charts, a replacement recommendation at the end. The board tabled it.
The second attempt rebuilt the same recommendation as an investment case. The team normalized the baseline against the GL, translated the $145k maintenance gap plus downtime revenue loss into a cash flow model, structured the roughly $1.5M ask into three gates starting with a 10-unit pilot, and led with the avoided-cost framing — roughly $1.9M–$2.2M of status-quo spend over four years if nothing changed.
The pilot gate was approved in the first meeting. After two quarters, the pilot cohort showed maintenance cost down in the expected band and uptime recovered enough to cut rental spend noticeably. Gate 1 passed, the next tranche released, and the full rollout followed on the strength of actuals that matched the model. Same recommendation, same vehicles — the only thing that changed was the translation layer between the shop floor and the boardroom.
Keeping the system running after approval
The investment case doesn't end at the yes. The most valuable thing you can build is a feedback loop between projected and actual returns. Every gate review is a chance to compare the model to reality, tighten your assumptions, and build credibility for the next request. Fleet managers who track actuals against their original NPV tend to find their second modernization case moves faster — the board already trusts their numbers.
This is also where modern maintenance platforms earn their keep in the financial story. When your work-order data, parts spend, and uptime metrics are centralized and clean, building the next investment case stops being a three-week spreadsheet exercise. The baseline is already normalized, the operational signals already tie to cost, and the translation from KPI to cash flow becomes something you can put together in days instead of weeks. The goal isn't a prettier deck — it's a reporting backbone trustworthy enough that finance stops discounting your projections.
A strong fleet modernization investment case is, at its core, an act of translation. You already have the operational truth. The work is converting it into the language of capital — cash, timing, and risk — and structuring the ask so the people holding the budget can say yes without feeling like they're gambling. Do that consistently, and modernization stops being the request that dies in committee and becomes the one the board actively wants to fund.
Ready to maximize fleet uptime and reduce maintenance costs?
Join 2,000+ fleet managers using Fleetelyly to streamline maintenance workflows and improve vehicle reliability.