



Most fleets don't replace vehicles too late because they lack data. They replace too late because nobody agreed, in advance, on what number pulls the trigger. So the F-350 with a transmission on its second rebuild keeps going another quarter, then another, and by the time it finally gets retired it's cost more in downtime and towing than a new unit would have in payments.
The opposite failure is just as common: someone panics after a bad repair month and pushes to replace units that still had plenty of economic life left, burning a CAPEX cycle on emotion instead of math.
What sits between those two failures is a fleet lifecycle cost framework — a set of gating rules and replacement triggers that connect the maintenance signals you're already generating to the actual investment decisions you make each quarter. Not a spreadsheet nobody opens. A working matrix that tells you, per asset class, when a vehicle crosses from "keep and maintain" into "flag for replacement" and eventually into "replace now, no debate."
This piece walks through how the whole system connects, where it breaks as fleets grow, and what a version that actually holds up under a quarterly investment review looks like.
Why lifecycle decisions drift out of control
The core problem is that the data needed to make a good replacement call lives in four different places, and none of them talk to each other on the timeline a decision requires.
Maintenance history lives in the shop system. Fuel and utilization live in telematics. Acquisition cost, depreciation schedule, and remaining book value live in finance. And resale reality — what a 2019 unit with 210k miles actually sells for at auction this quarter — usually lives in one person's head or a broker's inbox.
When it's time to decide, someone has to manually stitch those four sources together, per vehicle, under time pressure, right before a budget meeting. That's where the process falls apart. Nobody has the hours to build a real lifecycle picture for 180 units, so they proxy it: "this truck feels expensive" or "we always run these for six years." Proxies are how fleets end up over-investing in the wrong classes and starving the ones that actually need capital.
Worth naming a pattern that comes up regularly: the vehicles generating the loudest complaints from drivers and techs are frequently not the ones that are economically underwater. The squeaky unit gets attention. The quietly bleeding unit — reasonable per-repair costs but climbing frequency and falling uptime — coasts under the radar because no single repair is dramatic enough to force a conversation.
What actually breaks at scale
At 30 vehicles, one experienced manager can hold the whole fleet in their head. They know which units are trouble. Gut works, mostly.
Prevent costly breakdowns with proactive maintenance.
Fleetelyly helps you schedule, track, and manage every vehicle service efficiently.
- Automated maintenance reminders
- Real-time service tracking
- Parts inventory integration
No credit card required
At 150+ vehicles across three or four asset classes — light-duty vans, medium-duty box trucks, heavy-duty tractors, maybe an EV pilot — gut stops scaling. Several things break at once:
-
Asset classes get judged by the same yardstick. A cost-per-mile threshold that's sane for a Sprinter van is meaningless for a Class 8 tractor. Without class-specific triggers, you either replace vans too early or run tractors too long.
-
Replacement decisions bunch up. Everyone bought in the same good-budget year, so everyone hits end-of-life at the same time. A wave of CAPEX lands in one quarter and finance chokes on it.
-
Downtime cost stays invisible. The repair invoice is on the books. The revenue the unit didn't earn while it sat, the overtime to cover its route, the rental to backfill — none of that shows up next to the vehicle. So the true cost of keeping a marginal unit is understated every single time.
-
Resale timing gets ignored. A tractor sold at 550k miles versus 700k miles is a materially different check, but nobody models the resale curve, so units get run past the point where the residual has collapsed.
This is really a coordination failure more than an analytical one. The math on any single vehicle isn't hard. Keeping that math current, consistent, and comparable across a growing mixed fleet — that's the part that quietly falls over. If you haven't already tightened how you compare units across classes, the normalization work in our framework on fixing misleading fleet KPIs is the prerequisite for everything below. Triggers built on un-normalized numbers just automate bad decisions faster.
The three-zone gating model
Forget a single replace-vs-keep line. The cleaner structure is three zones, each with its own action, so a vehicle graduates through them instead of flipping states overnight.
| Zone | What it means | Typical signals crossing in | Action |
|---|---|---|---|
| Green — Retain | Economically healthy, invest normally | Cost/mile within class band, uptime above target, no major component at end of life | Standard PM, no flag |
| Amber — Watch | Trending toward replacement, model it | Rising repair frequency, one major component near failure, uptime slipping, resale value still decent | Add to quarterly review list, build lifecycle case |
| Red — Replace | Economics have crossed, act this cycle | Cumulative maintenance approaching replacement payment, major repair pending on high-mile unit, downtime cost material, residual falling fast | Trigger CAPEX request, sequence disposal |
The value of three zones is that Amber gives you lead time. A vehicle usually spends a quarter or two in Amber before it hits Red, which is exactly the window you need to line up capital, order the replacement, and time the disposal so you're not dumping a unit into a soft auction month.
The mistake teams make is treating any single trigger as sufficient. A high repair month alone shouldn't move a truck to Red — trucks have bad months. The trigger should fire on sustained signals or a combination: rising frequency and a pending major repair and a residual that's about to fall off a cliff. Compound conditions beat single thresholds every time.
A rough picture of how a unit moves through the zones:
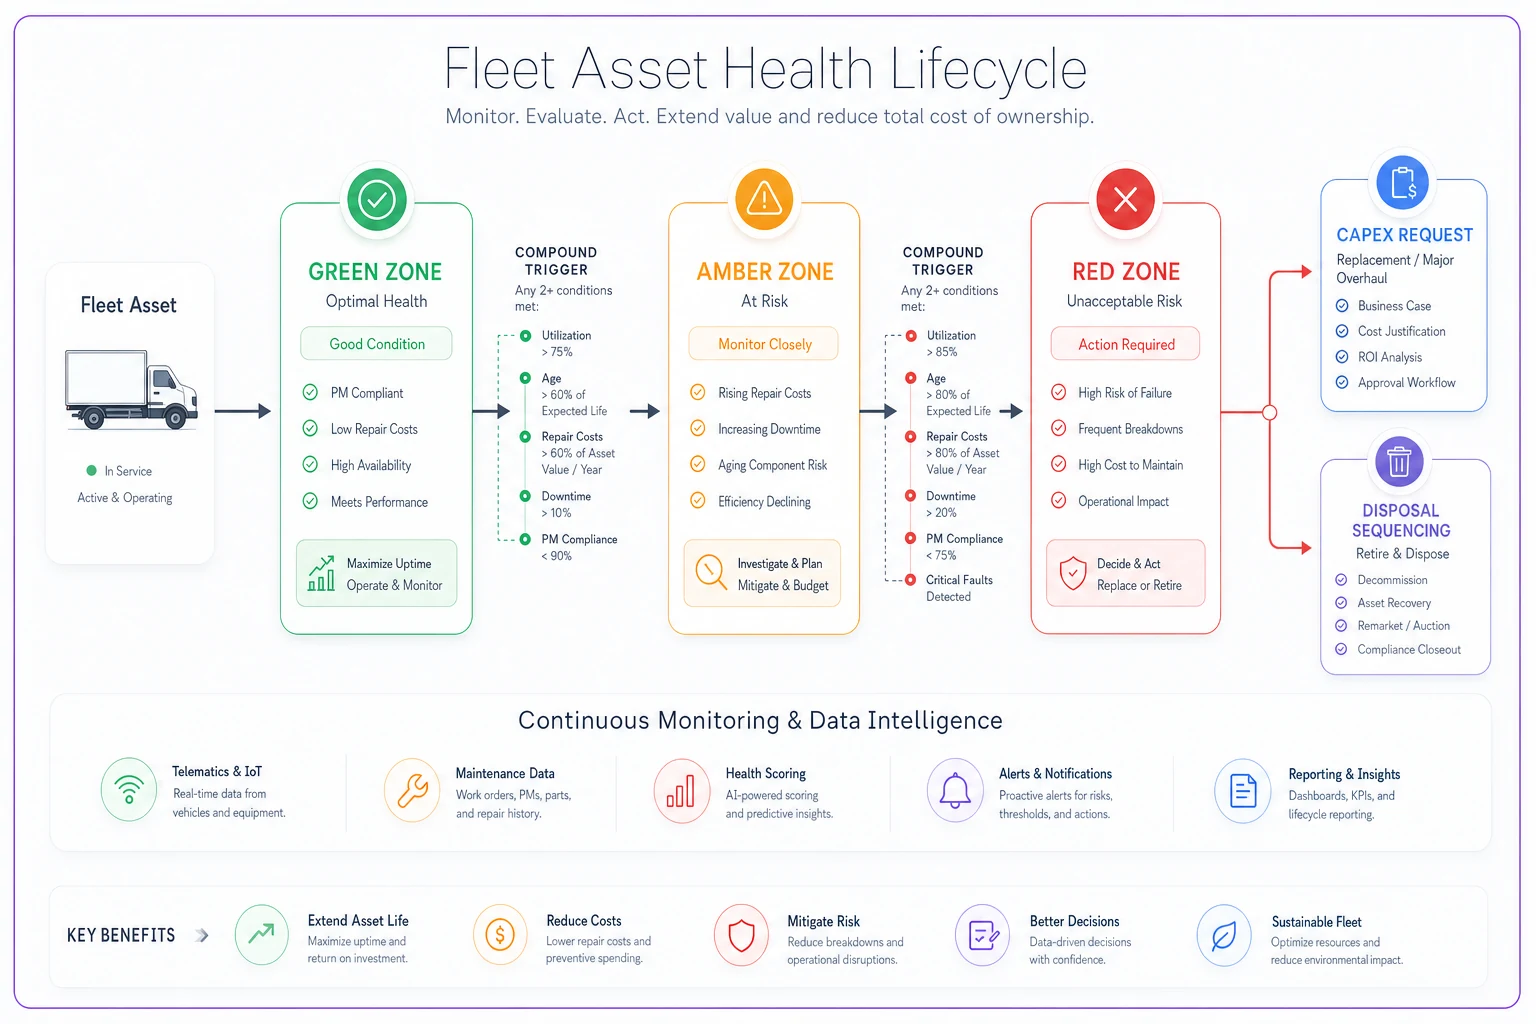
This flow shows the triggers that move a unit between zones and the two outcomes from Red: CAPEX Request and Disposal Sequencing.
Building the replacement-trigger matrix
Here's the sequence to build it so it survives contact with a real quarterly review.
-
Segment by asset class first. Vans, box trucks, tractors, specialty equipment. Every threshold below is set per class, never fleet-wide. This is non-negotiable and it's where most homemade versions fail.
-
Set a class-specific cost-per-mile (or cost-per-hour) band. Use your own trailing 24 months of data, not a vendor benchmark. Define the Amber and Red bands off your fleet's actual distribution — say, Amber at the 70th percentile of cumulative cost/mile for the class, Red at the 90th.
-
Add a component-lifecycle trigger. Some replacements are driven by one big-ticket item, not slow drift. A transmission or aftertreatment failure on a high-mile unit should be able to flip a vehicle straight to Red even if its running cost/mile looked fine.
-
Layer in a downtime-cost factor. Attach an estimated daily cost of a unit being out of service — backfill rental, lost utilization, overtime. Even a rough per-class number changes the math dramatically and stops downtime from staying invisible.
-
Model the resale impact. For each class, sketch the residual curve — what units actually sell for by age and mileage. The trigger should account for the value you lose by waiting, not just the cost you incur.
-
Define the compound Red condition. Write the actual boolean
e.g., "Red if (cost/mile > 90th pct) AND (pending repair > X% of monthly payment) OR (residual projected to drop > Y% in next two quarters)."
-
Lock the review cadence. The matrix outputs a ranked list each quarter. The list feeds the investment review. The review makes the call. Same rhythm every time.
The resale-impact step is the one everybody skips, and it's where real money hides. A tractor that drops from a $28k residual to $16k over a year of extra service isn't "free to keep" — you spent $12k in evaporated value to avoid a CAPEX conversation. Modeling that turns a lot of "keep it running" instincts into obvious replacement calls.
Prioritization when everything wants capital at once
You'll almost always have more Red and Amber units than budget. The matrix can't just flag — it has to rank. A simple, defensible prioritization score:
-
Economic urgency — how far past the Red threshold the unit is
-
Downtime exposure — how critical the route or function is if it fails
-
Residual decay — how fast you're losing resale value by waiting
-
Safety / compliance risk — any inspection or safety flag jumps the queue
-
Lead time reality — if a replacement takes six months to spec and deliver, it needs to be ordered before it's technically "due"
Score each dimension, weight them to fit your operation, and you get a ranked CAPEX list instead of a shouting match. The lead-time factor matters more than people expect — with current build and upfit timelines, a unit you order the quarter it hits Red won't arrive until it's well into failure territory. The trigger has to fire against delivery timing, not against the day the old unit finally dies.
This ranking is also what makes the quarterly review credible to finance. Instead of "the shop wants twelve new trucks," you show a scored, sequenced list tied to hard signals. That connects directly to the reserve and repair-vs-replace discipline covered in our fleet budgeting and chargebacks breakdown — the matrix produces the demand, the budgeting side sizes and phases the funding.
A real scenario
A regional service fleet — roughly 140 units, mostly medium-duty box trucks with a chunk of light vans — was running everything to about seven years on habit. No class-specific triggers, replacement decided in one rushed October meeting.
Once they built a matrix, their own data told a different story: a cluster of box trucks in years five and six were sitting in Amber-to-Red — repair frequency climbing, two of them facing pending drivetrain work that ran close to a couple months of what a new payment would cost. Meanwhile a batch of vans they'd assumed were aging out were economically fine and had years left.
By modeling resale, they also caught that their box trucks lost the bulk of their residual between years six and seven. Holding to seven was quietly costing them several thousand dollars per unit in lost auction value on top of the repair drift.
They rebuilt the plan around the ranked list: replaced about eight of the worst box trucks a year earlier than habit dictated, held the vans, and staged disposals into stronger auction windows. Unplanned downtime on that class dropped noticeably in the following year, and the earlier disposals recovered enough residual to offset a meaningful slice of the CAPEX that calendar-based timing would have wasted. Nothing dramatic on paper. Just the difference between deciding on signals versus deciding on the calendar.
When this framework makes sense — and when it doesn't
It makes sense when you're running enough units across multiple asset classes that gut-feel no longer holds the whole picture, when replacement decisions bunch into painful CAPEX waves, or when finance keeps pushing back on maintenance's requests because they're not tied to defensible numbers.
It's overkill when you're running a small fleet of a dozen similar vehicles under one manager who genuinely knows each unit. At that size the overhead of maintaining a matrix outweighs the benefit — a good rolling spreadsheet and clear repair-vs-replace rules do the job fine.
It's a bad idea when your underlying data isn't clean yet. If maintenance costs aren't consistently coded to the right vehicle, if telematics utilization is unreliable, or if you have no residual visibility, the matrix will output confident nonsense. Fix the data foundation first — triggers are only as good as the signals feeding them.
Who should hold off: teams without an actual quarterly review forum to act on the output. A matrix with no decision meeting attached just becomes another dashboard nobody uses. The gating structure only creates value when it feeds a standing decision cadence — which is the whole point of a proper maintenance governance framework with decision gates and CAPEX tradeoffs. The matrix is the fuel; governance is the engine that turns it into decisions.
Keeping it alive quarter to quarter
The failure mode of every good framework is that it gets built once, presented in one impressive review, and then slowly rots because nobody keeps the inputs fresh. A quick checklist to keep it honest:
-
Refresh cost/mile bands at least annually — your fleet's cost distribution shifts as the age mix changes
-
Re-check residual curves each quarter against actual auction and trade results, not last year's assumptions
-
Validate that maintenance costs are still coding cleanly to the right unit and class
-
Confirm downtime-cost estimates still reflect current rental rates and route economics
-
Audit a handful of Green units each cycle to make sure nothing is quietly slipping without tripping a trigger
-
Reconcile the previous quarter's replacement decisions against how those units actually performed — did the trigger call it right?
That last point matters most. The only way the matrix earns trust is by looking back: did the units you replaced turn out to be the right ones, and did the units you kept behave? A couple cycles of honest hindsight will tell you whether your thresholds are set too tight, too loose, or about right. That feedback loop is what separates a static spreadsheet from something that actually gets sharper over time.
The bigger picture
Lifecycle cost isn't really a finance topic or a maintenance topic — it sits in the seam between them, which is exactly why it gets neglected. Maintenance sees the symptoms, finance holds the capital, and the decision that connects the two happens once a quarter under time pressure with data scattered across systems.
Everything gets easier when the maintenance signals you already collect flow into a consistent, class-aware set of triggers, and those triggers produce a ranked list your quarterly review can actually act on. You stop replacing vehicles by calendar and start replacing them by evidence — before the downtime piles up, before the residual collapses, and without the annual CAPEX panic.
The data is already there. The framework is just what turns it into decisions you can defend.
Ready to maximize fleet uptime and reduce maintenance costs?
Join 2,000+ fleet managers using Fleetelyly to streamline maintenance workflows and improve vehicle reliability.