

Most fleet modernization projects don't fail because the technology was wrong. They fail because everything gets attempted at once — new telematics ingestion, a fresh work-order system, predictive models, parts integration — with no sequence, no freeze rules, and no clean way to back out when a migration goes sideways. Six months in, the old system is still running, the new one is half-populated, and nobody trusts either set of numbers.
The way out isn't a bigger project plan. It's a phased roadmap where each stage has a narrow scope, a measurable exit condition, and a defined rollback. You don't move forward until the current phase holds up under real shop load. That's the whole point of quarterly gates — they force you to prove value before you spend more.
This is written for fleet managers and maintenance teams who already run a shop, already have some telematics and some kind of work-order tracking, and want to modernize without blowing up daily operations. The structure below is a timeline: 0–6 months, 6–12, 12–24, and 24+. Each phase carries its own data assets, integration slices, org changes, KPI targets, and exit gates.
The core sequencing principle: data before integrations, integrations before automation
One rule that saves projects before the timeline even starts: you can't integrate what you can't define, and you can't automate what you can't trust.
Teams usually reverse this. They buy an integration platform, wire telematics into the work-order tool, and then discover their asset IDs don't match across systems — the same truck has three different identifiers in fuel, telematics, and maintenance. Every downstream report is garbage, and no dashboard will fix a broken join key.
-
Minimal master data + event taxonomy — get your core entities clean and consistent
-
Prioritized integration slices — bring in data in thin, testable increments
-
Operating-model and org changes — the people and process shifts that make the data stick
-
Automation and predictive layers — only after the foundation holds
Skip step one and everything built on top inherits the mess. The minimal master-data and event-taxonomy blueprint covers what "clean core" actually means — the short version is a canonical asset registry, a shared event vocabulary (fault, work order opened, part consumed, PM completed), and one source of truth for each entity.
Phase 1 — Months 0–6: Establish the spine
The goal of the first two quarters is not features. It's a trustworthy data spine and one proven integration. If you leave this phase with a clean asset registry and a single reliable telematics→work-order flow, you're ahead of most fleets that have been "modernizing" for two years.
Prevent costly breakdowns with proactive maintenance.
Fleetelyly helps you schedule, track, and manage every vehicle service efficiently.
- Automated maintenance reminders
- Real-time service tracking
- Parts inventory integration
No credit card required
Minimal data assets to nail first
Keep this deliberately small. The temptation is to model everything — resist it.
-
Canonical asset registry — one row per vehicle/equipment, one primary ID, with mappings to every legacy ID (fuel card, telematics device, VMRS coding, insurance)
-
Location and cost-center hierarchy — because chargebacks and reporting fall apart without it
-
Event taxonomy v1 — a short list of standardized events every system agrees on
-
Parts master (core SKUs only) — the top 200–300 SKUs that cover most work, not your entire catalog
The first integration slice
Pick exactly one high-value flow. For most fleets it's telematics fault codes into work-order creation. Bring it in as a thin slice — a handful of fault codes mapped to a triage decision, not the full firehose.
Here's the sequencing within the slice:
| Step | What you do | Exit signal |
|---|---|---|
| Read-only ingest | Pull telematics events into a staging table, no work orders created | Event volume matches device count; <2% dropped |
| Shadow mapping | Map faults to proposed work-order actions, log only | Proposed actions reviewed by a lead, >85% agreement |
| Limited write | Auto-create work orders for 3–5 well-understood fault codes | No duplicate WOs; techs accept the routing |
| Widen | Add fault codes in small batches | Each batch clears its own review before the next |
The data-contract playbook for CDC, APIs and event-driven flows goes deep on why this thin-slice approach beats big-bang integration — the recurring failure is teams treating an integration as done at "data flows" instead of "data flows and the contract holds under schema drift."
Data freeze and backfill rules
The moment you start writing to a new system, you need rules for what happens to history and in-flight records.
-
Freeze window pick a cutover date for each entity. Before that date, the legacy system is truth. After, the new one is. No overlap where both accept edits.
-
In-flight work orders don't migrate open WOs mid-repair. Let them close in the old system; only new WOs open in the new one. Track the tail until it drains.
-
Backfill depth backfill 12–18 months of closed work-order history for baseline KPIs, not everything. Older data usually has too many quality gaps to be worth the effort.
-
Backfill validation reconcile record counts and total labor hours between old and new before declaring the backfill complete. A 3–5% variance needs an explanation, not a shrug.
Org and operating-model changes
Small but non-negotiable:
-
Assign a single data owner for the asset registry — one person who says yes or no on ID changes.
-
Add a daily 10-minute stand-up for the migration team during active cutover weeks.
-
Write a one-page "which system do I use for what" cheat sheet and put it in the shop. Ambiguity here is what kills adoption.
Phase 1 KPI targets and the gate
You're not chasing MTTR gains yet. You're proving trust.
-
Asset registry match rate across systems
≥ 98%
-
Telematics event capture (ingested vs. emitted)
≥ 97%
-
Auto-created work orders accepted by techs without rework
≥ 85%
-
Backfill reconciliation variance
within 5%
Gate to Phase 2: all four hold for two consecutive weeks under normal shop volume. If not, you stay in Phase 1. Rolling forward with a broken spine just moves the failure downstream.
Rollback criteria: if auto-created WOs generate duplicates or misroute work more than roughly 5% of the time, cut writes back to shadow mode within a day. The staging data stays; only the write step reverts.
Phase 2 — Months 6–12: Widen integrations and formalize governance
With a trusted spine in place, Phase 2 adds the integrations that actually change daily workflow and puts real governance around change. This is where coordination between shop, parts, and finance starts to matter.
Prioritized integration slices for this phase
Sequence by value and risk, not by whichever vendor has the easiest API:
-
Parts consumption → inventory (CDC on parts issued against WOs so stock counts stay live)
-
PM schedule engine → work-order generation (recurring PMs auto-open instead of living in a spreadsheet)
-
Labor/time capture → WO costing (so a work order carries real cost, not estimates)
-
Warranty-flag events (tag WOs that may be warranty-recoverable at creation, not months later)
Each of these is its own thin slice with its own shadow → limited → widen cycle. Resist the urge to run three integrations in parallel in the same quarter. One team can genuinely stabilize one integration at a time; two in flight means neither gets a clean review.
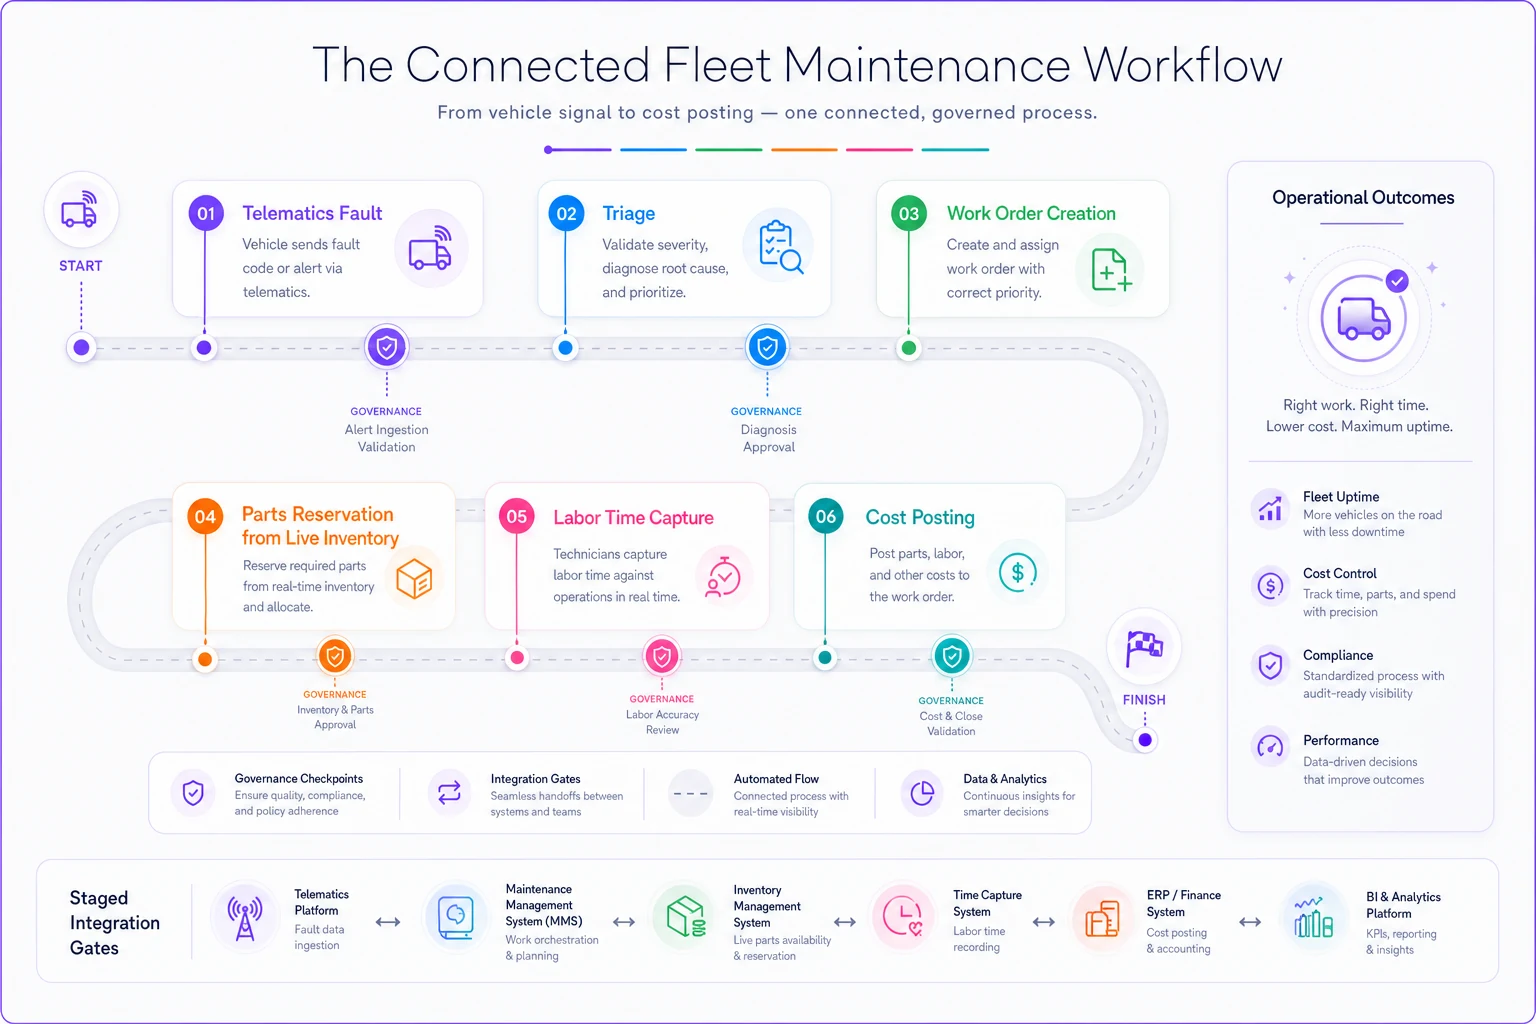
A workflow that starts to connect
Here's what "connected" actually looks like once these slices land:
-
A telematics fault comes in and gets triaged into a work order.
-
The WO auto-reserves the parts kit from live inventory.
-
Labor time gets captured against that WO.
-
When it closes, the cost lands in the right cost center.
-
If the fault pattern matched a warranty rule, the WO was flagged the day it opened.
Before this, those were five disconnected steps handled by four people with three spreadsheets. The failure point wasn't any single step — it was the handoffs between them, where records got dropped or re-keyed into something slightly different.
A simple diagram of that connected workflow can help align teams and reviewers.
Governance: the operating-model shift that makes it stick
This is the phase to stand up formal decision gates. Ad-hoc changes to schedules, thresholds, and CAPEX triggers are what slowly erode a modernized system over the following year. The maintenance governance framework with decision gates and quarterly reviews lays out the cadence — a quarterly review where PM intervals, reorder points, and repair-vs-replace thresholds get revisited with data instead of gut feel.
-
Stand up a monthly data-quality review — dashboards for match rates, dropped events, reconciliation variance
-
Define change-control for the event taxonomy — any new event type needs the data owner's sign-off
-
Move PM interval decisions into the quarterly governance meeting with actual completion and failure data on the table
Phase 2 KPI targets and the gate
Now you can start measuring operational outcomes:
-
Live inventory accuracy vs. physical count
≥ 95%
-
PM completion rate (auto-generated PMs closed on time)
improve to ~90%+ from wherever you started
-
WO cost completeness (WOs closing with parts + labor captured)
≥ 92%
-
Warranty-flag capture rate
catching clear cases early rather than after the window closes
Gate to Phase 3: inventory accuracy and cost completeness hold, and the governance cadence has run at least one full quarterly cycle that actually changed a decision. If governance is just a meeting where nothing gets adjusted, it's theater — don't gate on the meeting existing, gate on it producing a real change.
Rollback criteria: if the PM engine floods the shop with more auto-generated PMs than capacity can absorb (backlog growing week over week), throttle generation back to a manual-approval queue while you retune intervals. Don't let a scheduling integration create the very backlog it was meant to prevent.
Phase 3 — Months 12–24: Analytics, prediction, and cross-fleet coordination
Only now, with clean data and stable integrations feeding it, does predictive work become worth attempting. Predictive maintenance built on a shaky data spine produces confident-sounding nonsense — the model learns from garbage timestamps and mislabeled failures, and then everyone stops trusting it after a few bad calls.
What this phase adds
-
Failure pattern analytics across the fleet, not per-vehicle guesswork
-
Predictive flags for a narrow set of high-value, high-frequency failure modes — start with two or three components where you have dense, clean history
-
Cross-fleet coordination — parts rationalization, shared benchmarks, capacity balancing between locations
-
Feedback loops where model outputs and governance decisions inform each other over time
When prediction actually makes sense
Predictive maintenance earns its place when three things are true: you have 18+ months of clean, labeled failure history for the component, the failure is expensive or safety-relevant, and you have the parts and capacity to act on an early warning. Miss any of those and you're running a science project.
When it's a bad idea: predicting failures on low-cost components you already run to failure economically. The model costs more to build and maintain than the failures cost you.
Who should not do this yet: any fleet where Phase 1 and 2 KPIs haven't held. If your asset match rate is sitting at 94% and inventory accuracy is at 88%, prediction will amplify those errors, not overcome them.
Phase 3 KPI targets and the gate
-
Reduction in unplanned failures for targeted components
a meaningful, measurable drop over the baseline
-
Predictive flag precision
high enough that techs act on flags instead of ignoring them — low-precision alerts train people to dismiss the whole system
-
Cross-fleet parts SKU reduction from rationalization
a real dent in carrying cost
Gate to Phase 4: predictive flags are being acted on and demonstrably preventing failures, and false-positive fatigue is under control. If techs are ignoring flags, you gate back — retune before scaling.
Phase 4 — Months 24+: Optimization and steady-state operating model
Past the two-year mark, the work shifts from building to tuning. The systems exist; the question is whether the operating model keeps them honest as the fleet changes, vehicles turn over, and new equipment types arrive.
What steady state looks like
-
Quarterly governance reviews that routinely adjust thresholds based on actual data
-
A stable data-quality baseline that doesn't degrade between reviews
-
New vehicle onboarding that follows a repeatable playbook — new asset, mapped IDs, correct cost center, PM schedule assigned, all on day one
-
Integrations that survive vendor API changes because the contracts were defined, not assumed
The failure mode nobody plans for
The most common Phase 4 collapse isn't technical. It's drift. The data owner leaves, nobody replaces the role, ID hygiene slips, and eighteen months later the match rate has quietly eroded back to where it started. Modernization isn't a project you finish — it's an operating model you maintain. Bake the roles into job descriptions, not into one person who happens to care.
A realistic scenario
A mid-size regional fleet — roughly 180 mixed vehicles across three yards — had telematics, a work-order tool, and a parts spreadsheet that lived on one person's desktop. Fault alerts came in by email. Work orders were created by hand. Warranty claims were mostly lost because nobody flagged eligible repairs in time.
They ran this roadmap over about 20 months. Phase 1 took closer to seven months than six — the asset registry cleanup alone surfaced around 40 vehicles with mismatched IDs across systems. But once the spine was clean, the later phases moved faster than expected.
By the end of Phase 2, live inventory accuracy had climbed from somewhere in the low 80s to the mid-90s, and warranty flags caught a batch of recoverable repairs that had previously slipped past the window — worth more in a single quarter than the integration work had cost. Unplanned failures on their two worst-performing component types dropped noticeably after the Phase 3 predictive flags went live, though the bigger win was simpler: dispatch and parts finally trusted the same numbers.
Worth reporting honestly: they missed their first Phase 1 gate. Auto-created work orders were duplicating, they rolled back to shadow mode for two weeks, fixed the dedup logic, and re-gated. That two-week reversal is exactly why the gate existed.
Bringing the phases together
The reason this sequence works isn't the specific quarter boundaries — adjust those to your reality. It's the discipline of narrow scope plus a hard exit condition plus a defined rollback at every stage. You never advance on hope. You advance on proof that the current layer holds under real load.
Most fleets that struggle with modernization aren't short on tools. They're short on sequencing. They build integrations on unstable data, layer prediction on unstable integrations, and then wonder why nobody trusts the dashboards. A fleet maintenance modernization roadmap with quarterly gates flips that: it makes trust the prerequisite for every next step, and it gives you a clean way to back out when a step doesn't earn it.
Start with the spine. Prove it. Then widen — one thin slice at a time.
Start with the spine. Prove it. Then widen — one thin slice at a time.
Ready to maximize fleet uptime and reduce maintenance costs?
Join 2,000+ fleet managers using Fleetelyly to streamline maintenance workflows and improve vehicle reliability.