


Your shop has eight bays, twelve technicians, and somehow vehicles are still sitting in the parking lot waiting for service. Techs are hustling, parts are in stock, everyone's working overtime. Throughput hasn't moved in two years.
This isn't a staffing problem or a parts problem. It's a flow problem.
The same lean principles that transformed manufacturing floors in the 80s apply directly to maintenance shops. But most fleet managers never learned takt time or bottleneck mapping because they came up through the wrench-turning side of the business, not industrial engineering.
Why Traditional Shop Metrics Miss the Real Problem
Most maintenance shops track the wrong things. They measure wrench time, bay utilization, jobs completed per day. These metrics tell you what happened, not why, and definitely not how to fix it.
A municipal fleet shop tracked bay utilization religiously. Eight bays showing 85% utilization on paper. Looked efficient. But when we mapped actual vehicle flow, vehicles were spending 40% of their time in a bay waiting—for parts, for the right tech, for diagnostic equipment, for inspection sign-off.
Bays occupied, not productive. Like measuring highway efficiency by counting cars during rush hour.
Maintenance shop flow takt time reveals what those traditional metrics hide. It shows you the rhythm of work moving through your shop, where that rhythm breaks, and which specific changes will actually restore flow.
Understanding Takt Time for Maintenance Operations
In manufacturing, takt time is simple: available production time divided by customer demand. In maintenance, it's messier because every job is different. A brake job takes two hours. An engine rebuild takes two days. A pre-trip inspection takes twenty minutes.
Prevent costly breakdowns with proactive maintenance.
Fleetelyly helps you schedule, track, and manage every vehicle service efficiently.
- Automated maintenance reminders
- Real-time service tracking
- Parts inventory integration
No credit card required
What most people miss—you don't need perfect uniformity to apply takt time thinking. You need job families.
-
Quick services (oil changes, inspections, tire rotations)
30-90 minutes
-
Standard repairs (brakes, suspension, exhaust)
2-4 hours
-
Major repairs (transmission, engine, differential)
8+ hours
-
Diagnostics and troubleshooting
1-3 hours
Now calculate takt time for each family. If your shop runs 450 minutes per day and you average six oil changes daily, your quick-service takt is 75 minutes. Not per job—that's the rhythm. Every 75 minutes, a completed oil change should roll out.
A private trucking company discovered their actual quick-service takt was running around 110 minutes instead of the 75 they needed. That gap explained why PMs kept backing up despite having what looked like enough capacity on paper.
| Job Family | Typical Duration |
|---|---|
| Quick services (oil changes, inspections, tire rotations) | 30-90 minutes |
| Standard repairs (brakes, suspension, exhaust) | 2-4 hours |
| Major repairs (transmission, engine, differential) | 8+ hours |
| Diagnostics and troubleshooting | 1-3 hours |
A private trucking company discovered their actual quick-service takt was running around 110 minutes instead of the 75 they needed. That gap explained why PMs kept backing up despite having what looked like enough capacity on paper.
Arrival Pattern Analytics That Actually Matter
Most shops think arrivals are random. They're not. They follow patterns you can predict and plan around.
Map arrivals for 90 days. Not just counts—map them by hour of day, day of week, job type, vehicle type, and planned versus breakdown.
Patterns show up fast. Monday mornings flood with weekend breakdowns. Thursday afternoons see scheduled PM rushes as drivers try to get serviced before Friday routes. End-of-month brings inspection deadlines.
A waste management fleet found 35% of their arrivals clustered between 7–9 AM on Mondays. Their fix wasn't more staff—it was a dedicated "Monday morning triage bay" that assessed and staged vehicles before they hit the actual repair queue. Cut their Monday bottleneck roughly in half without adding a single tech hour.
The patterns also reveal true capacity needs. That same municipal shop? They needed around 12 quick-service slots on Mondays but only 4 on Fridays. They'd been staffing the same all week.
Bottleneck Mapping Through Simple Observation
Forget complex software for now. The best bottleneck analysis starts with a clipboard and a stopwatch.
Track ten vehicles through your shop. Not the work time—total time. When did it arrive? When did work start? When did it finish? When did it leave?
-
Waiting for bay assignment
-
Waiting for technician assignment
-
Waiting for parts
-
Waiting for special tools
-
Waiting for QC inspection
-
Waiting for customer approval
-
Waiting for pickup
Time the gap between repair completion and vehicle departure—that often reveals hidden waits techs don't notice.
A transit authority tracked fifty buses this way. Average repair time: 3.2 hours. Average total time in shop: 8.7 hours. The difference was pure waste.
Their biggest bottleneck wasn't what anyone expected. It was a single alignment rack that every vehicle with suspension work had to pass through. Techs would finish the repair, then sit waiting for rack availability. Adding a second rack cost around $165,000 and paid for itself within four months.
Here's a simple visual to guide a bottleneck-mapping session in your shop.
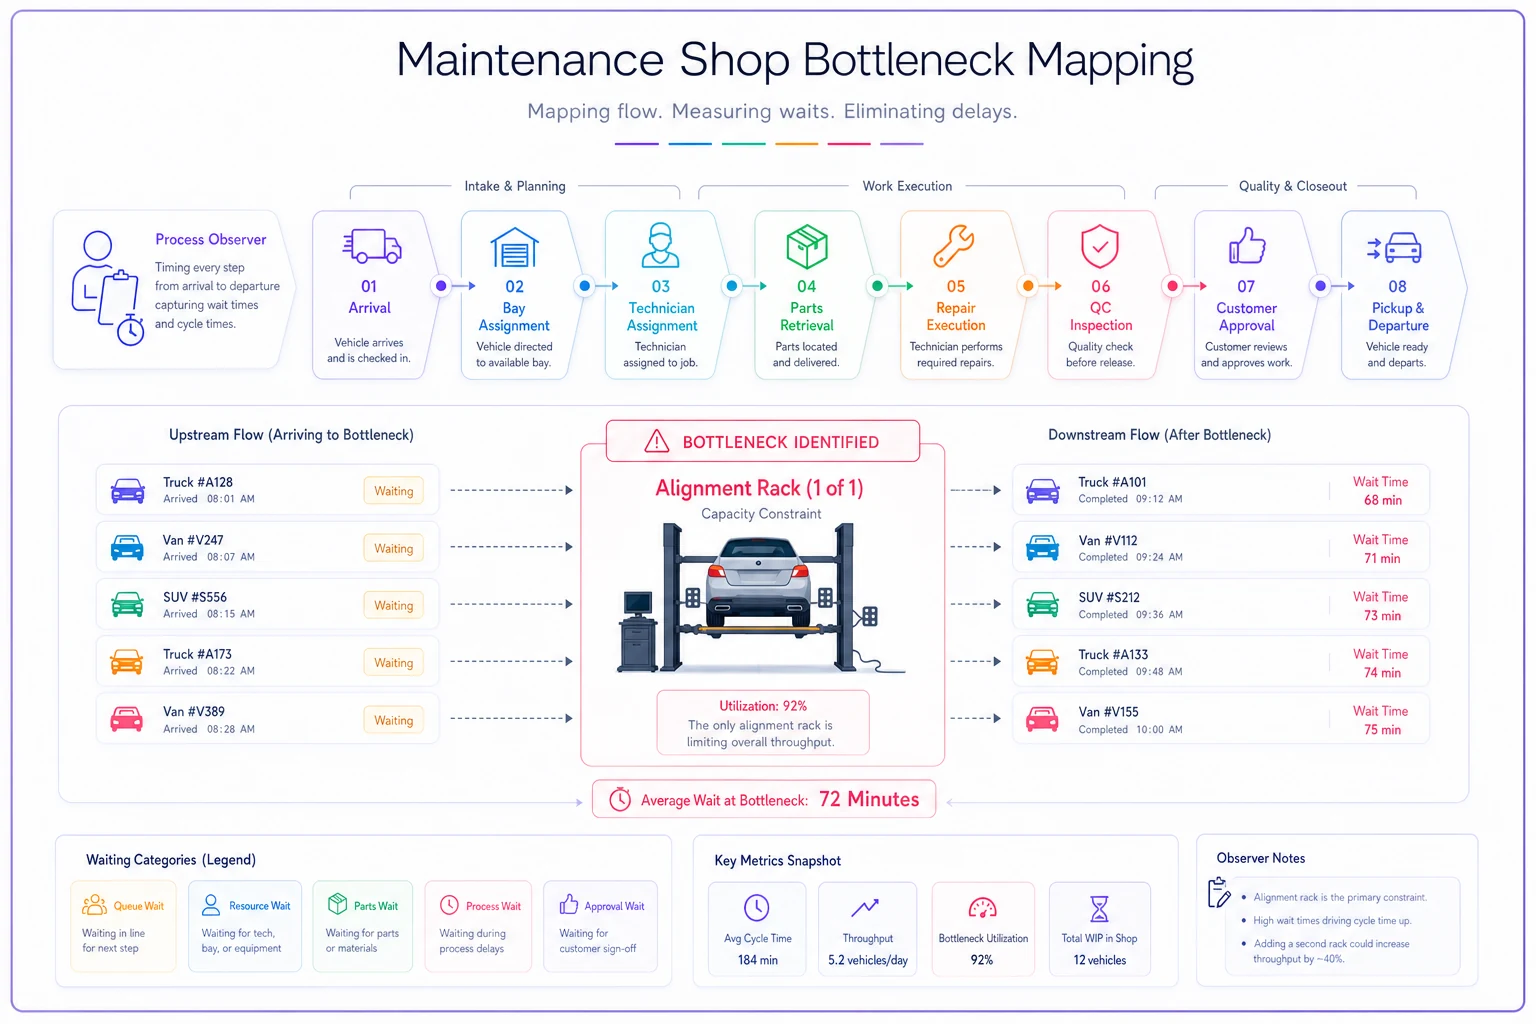
Use that visual as a one-page guide during your clipboard-and-stopwatch audit.
Low-Cost Layout Changes That Transform Flow
Big shops buy new equipment. Smart shops rearrange what they have.
Most maintenance bay layouts evolved randomly. The tire machine ended up there because that's where power was. The parts room is there because it's always been there. The diagnostic computers are in the office because that's where the network drops were.
Map your layout against actual workflow. How far does a tech walk for parts? How many times does a vehicle move between arrival and departure? Where do bottlenecks physically show up as vehicles sitting and waiting?
-
Moved high-frequency parts (filters, belts, brake pads) to mobile carts positioned between bay pairs
-
Created a dedicated "fast lane" bay for sub-60-minute services with its own parts inventory
-
Repositioned diagnostic equipment to a central location accessible from four bays instead of one
Cost: roughly $8,000 in shelving, carts, and equipment relocation. Result: around 22% throughput improvement within six weeks.
Walking distance matters more than people think. A technician walking to the parts room eight times per job at 90 seconds round trip loses 12 minutes per job. Across six jobs daily, that's 72 minutes per tech. Multiply by your headcount.
Running Simple Simulations Without Complex Software
You don't need simulation software to test changes. A spreadsheet works fine for most shops.
Build a simple model: bays as columns, time slots as rows (15-minute increments), color-coded by job type. "Schedule" a typical day using your current process.
Then test changes. What if two bays were dedicated to quick service only? What if you staggered tech shifts to match arrival patterns? What if you batched similar repairs?
A municipal fleet tested dedicating one bay exclusively to police vehicles. Their model showed turnaround dropping from 14 hours average to 6. The actual result was 5.5 hours—better than projected.
That transit authority considering a second alignment rack ran the simulation first. The model predicted 30% throughput improvement. Reality delivered 28%. Close enough to justify the spend.
Measuring Impact with Before/After KPIs
Standard shop metrics won't capture flow improvements. You need KPIs that measure movement, not just activity.
-
Flow efficiency
(Value-adding time / Total cycle time) × 100
-
First-time fix rate
Jobs completed without the vehicle returning within 7 days
-
Daily throughput
Vehicles completed, not just vehicles worked on
-
Queue time
Average wait before work actually begins
-
Cycle time by job family
Total time per job type, arrival to departure
Track these for 30 days before making any changes. That's your baseline.
A private fleet with 150 vehicles ran their baseline: 34% flow efficiency, 78% first-time fix rate, 18 vehicles daily, 4.2-hour average queue time. After implementing takt time scheduling and layout changes: 52% flow efficiency, 81% first-time fix, 24 vehicles daily, 2.1-hour queue time.
Same staff, same equipment, same budget. Just better flow.
-
Overtime hours (should decrease)
-
Vehicle rental costs (should decrease)
-
Customer complaints (should decrease)
-
Technician satisfaction (should increase—less chaos means less burnout)
Watch secondary metrics too: the ones above often shift as flow improves and help validate broader operational benefits.
Common Pitfalls When Implementing Takt Time
The biggest mistake shops make is trying to force manufacturing precision onto maintenance variability. A transmission rebuild will never be as predictable as assembling widgets.
Plan for variability instead of fighting it. Build buffer into takt calculations. If quick services average 45 minutes with a 15-minute standard deviation, plan for 60-minute takt. Occasional idle time beats constant backup.
The second mistake is ignoring job family mix changes. Takt time assumes a certain ratio of quick service to major repairs. When that ratio shifts—during inspection season or after weather events—your takt times need to shift too.
A utility company fleet learned this the hard way. They calculated takt times based on annual averages, then storm season hit. Suddenly 70% of work was body damage and electrical repairs instead of the usual 30%. Their finely-tuned system fell apart. Now they maintain three takt time scenarios: normal operations, storm response, and PM surge.
The third mistake is calculating takt time and then doing nothing with it. Knowing oil changes should complete every 75 minutes means nothing if nobody's watching the clock. You need visual management—a board, screen, or tracking system showing target versus actual completion in real time.
When Takt Time Makes Sense (And When It Doesn't)
Takt time and bottleneck analysis work best for shops with predictable, repeating work, sufficient volume to establish patterns (roughly 10–15 vehicles daily minimum), some control over arrival timing, and the ability to group similar work.
They struggle in shops dealing with highly variable emergency repairs, low volume and high complexity, no control over arrivals, or a single vehicle type with wildly different repair needs each time.
A specialized emergency vehicle shop tried implementing takt time for ambulance maintenance. It failed completely. Every vehicle had different equipment, different damage, different urgency. They shifted to capacity planning by technician skill instead, which matched their scheduling reality much better.
Even so, bottleneck analysis still delivered value. That same shop discovered their constraint wasn't repair work at all—it was the decontamination bay every ambulance had to clear. Adding a second decon station improved throughput by about 30%, no takt time required.
Building Your Implementation Roadmap
Start with one job family. Quick services usually work best. Run takt time for just that category for 30 days. Learn what holds, what breaks, what needs adjustment before expanding.
Week 1–2: Data collection
-
Track arrivals, cycle times, wait times
-
Map physical flow through the shop
-
Identify obvious bottlenecks
Week 3–4: Analysis and planning
-
Calculate job family groupings
-
Determine takt times
-
Simulate proposed changes
-
Plan layout modifications
Week 5–8: Limited implementation
-
Start with your highest-volume job family
-
Make low-cost layout changes
-
Train the team on takt time basics
-
Establish visual management
Week 9–12: Refinement
-
Adjust takt times based on what you're actually seeing
-
Expand to a second job family
-
Address any new bottlenecks that surfaced
-
Document improved KPIs
Most shops see real improvement within 60 days. Not perfection—improvement. A corporate fleet with 300 vehicles saw roughly 15% throughput improvement in month one, around 25% by month three, leveling off near 35% by month six.
Treat it as continuous improvement, not a one-time fix. Fix the alignment rack bottleneck and parts delivery becomes the constraint. Fix that and diagnostic equipment becomes the limit. The bottleneck always moves—that's the point. Keep hunting it.
Connecting Flow Improvements to Operational Excellence
Better flow means more than faster repairs. It means predictable capacity for preventive maintenance scheduling, lower rental costs, better customer communication, and a shop that doesn't feel like it's constantly on the edge of falling apart.
When vehicles move predictably through your shop, parts ordering gets more accurate, technician scheduling smooths out, and you can actually give customers a realistic completion time instead of guessing.
The discipline of thinking about maintenance shop flow takt time forces you to see your operation as a system. Once you see the system, you can optimize it. Once you optimize flow, you find capacity you didn't know existed.
A regional utility fleet put it well after working through this: "We thought we needed a bigger shop. Turns out we just needed to use the one we had properly. Same building, same team, 40% more vehicles serviced per month."
Moving from Chaos to Rhythm
When you understand arrival patterns, calculate realistic takt times, identify true bottlenecks, and make targeted improvements, work starts flowing instead of flooding.
The math isn't complicated. The concepts aren't new. But the impact is real. Start with observation. Map your flow. Calculate your takt. Find your constraint. Make one change. Measure it. Repeat.
Most shops are nowhere near their actual capacity. They're limited not by people or equipment but by flow. Fix the flow, and you'll realize you've been running at 60% capacity while everyone felt like they were at 110%.
The question isn't whether takt time principles can improve your operation. The question is which bottleneck you're going after first.
Ready to maximize fleet uptime and reduce maintenance costs?
Join 2,000+ fleet managers using Fleetelyly to streamline maintenance workflows and improve vehicle reliability.